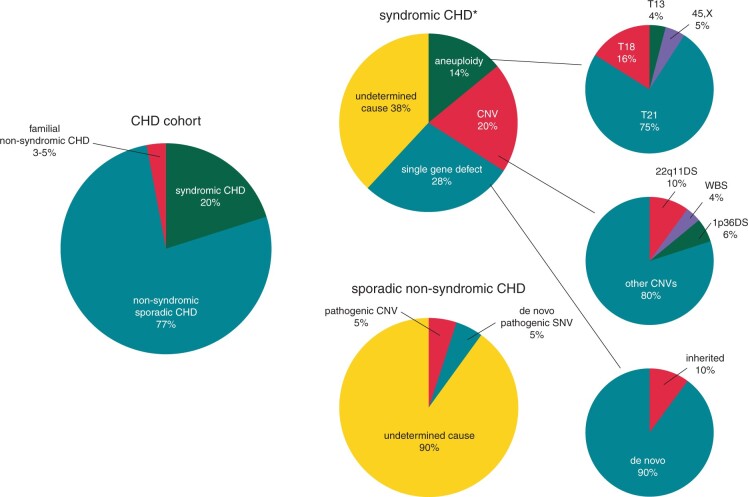
Figure 7.
Genetic causes of congenital heart defects. Non-syndromic (lower panel) and syndromic (upper panel) cohorts. The diagram in the left panel displays the relative prevalence of the three broad CHD subgroups, namely syndromic CHD, sporadic non-syndromic CHD, and familial non-syndromic CHD. The diagrams in the central panel display the current yield of standard karyotyping, CMA and WES/WGS in the non-syndromic (lower panel) and syndromic (upper panel) cohorts, respectively, illustrating the low diagnostic yield in sporadic non-syndromic CHD, compared to the syndromic cohort. The pie diagrams at the right display the most common causes of aneuploidies and of CNVs, and the inheritance pattern of single gene defects. The percentages displayed in the diagrams are based on.440,441,445,463,464 CHD, congenital heart defect; CNV, copy number variant; T13, trisomy 13; T18, Trisomy 18; T21, trisomy 21; WBS, Williams–Beuren syndrome.

