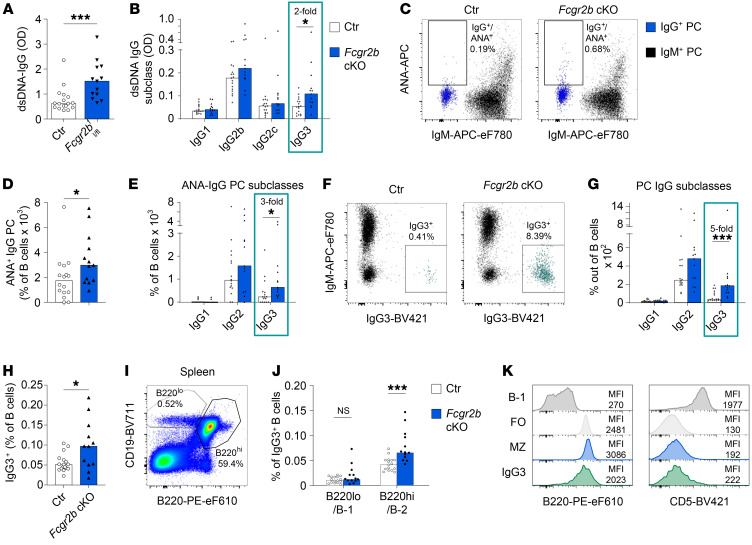
Figure 1. Increased spontaneous autoantibody IgG3 responses in Fcgr2b-cKO mice.
Female control (Ctr) and Fcgr2b-cKO mice were bred and maintained until experiments at 10–12 months of age, at which point (auto)antibodies in serum and PCs in spleen were characterized. ANA reactivity of PCs was established using flow cytometry. (A and B) dsDNA ELISA for total IgG and IgG subclasses in serum from Fcgr2b-cKO mice. (C) Representative example of ANA staining in IgG and IgM PCs in spleen. (D and E) Frequency of ANA+ IgG+ PCs in spleen, total IgG (D), and by IgG subclass (E). (F) Representative example of IgM and IgG3 staining in total PCs. IgG3+ cells are indicated in green. (G) Frequency of IgG+ PCs in spleen separated by subclass. (H) Frequency of IgG3+ B cells in control and Fcgr2b-cKO mice. (I) Representative example of staining strategy for B-1 and B-2 cells in spleen. (J) Percentage of splenic IgG3+ B cells with a B-1 or B-2 phenotype, respectively, gated as in I. (K) Representative example of staining for B220 and CD5 in total IgG3+ B cells compared with B-1, FO, and MZ B cells in spleen. Data are shown as the median, with each symbol representing an individual mouse (A, B, D, E, G, H, and J) (n = 12–17 per group pooled from 2–3 independent experiments). *P < 0.05 and ***P < 0.001, by Mann-Whitney U test.

