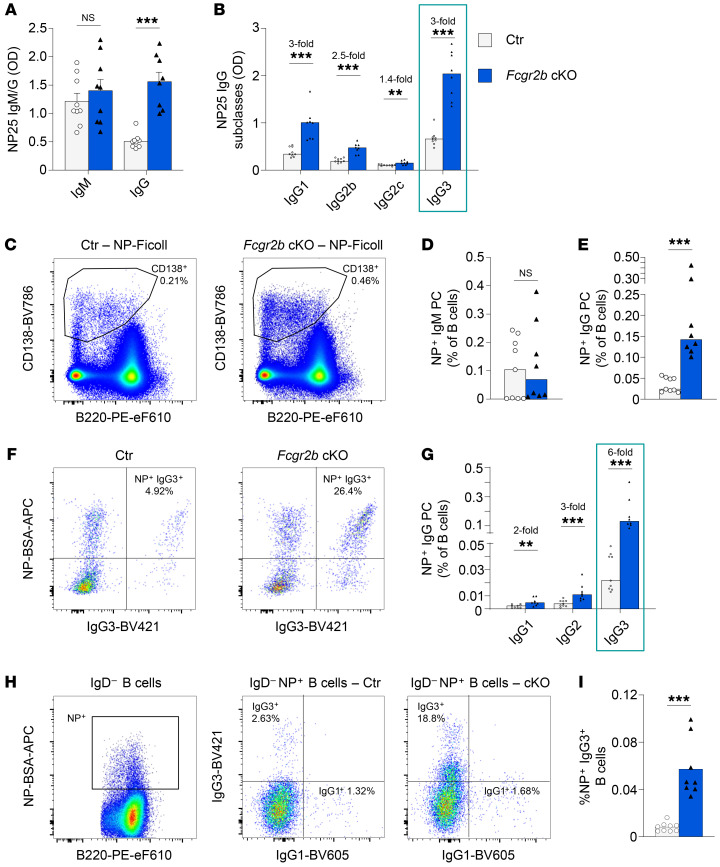
Figure 2. Increased extrafollicular responses following immunization.
(A–F) Female control and Fcgr2b-cKO mice were immunized with NP-Ficoll. Serum and splenocytes were obtained 7 days later. (A and B) Levels of NP-specific antibodies, separated by isotype and subclass. (C) Representative example of PC staining following NP-Ficoll immunization (concatenated data on 4000 cells from 4 different mice per group). (D and E) Frequency of NP-specific PCs in spleen by isotype, as a percentage of B cells. (F) Representative examples of intracellular IgG3 and NP staining in splenic PCs. (G) Frequency of NP-specific PCs in spleen as a percentage of B cells, separated by IgG subclass. (H) Representative example of surface NP gating on IgD– B cells (left) and IgG1 and IgG3 staining in IgD–NP+ B cells (middle and right; ~10,000 cells were concatenated from 4 mice per group). (I) Frequency of IgG3+NP+ B cells among total B cells. Data are shown as the median, with each symbol representing an individual mouse (n = 8–9 mice per group; data were pooled from 2–3 independent experiments). **P < 0.01 and ***P < 0.00, by Mann-Whitney U test.

