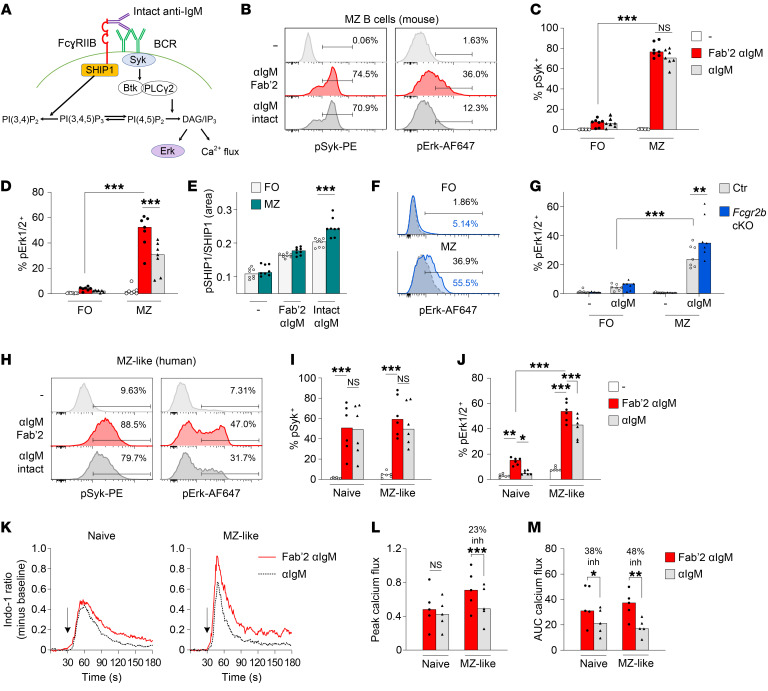
Figure 4. The effect of FcγRIIB on B cell signaling in MZ B cells.
(A) Simplified schematic diagram of key signaling molecules downstream of the BCR and FcγRIIB. (B–D) Representative examples and summary of FO and MZ B cells from control mice; cells were stimulated with 3 μg/mL intact anti-IgM (αIgM) or equimolar concentrations (2 μg/mL) of Fab′2 anti-IgM for 10 minutes, followed by Phosphoflow analysis of the phosphorylation of signaling molecules. (E) SHIP1 phosphorylation was analyzed by capillary Western blotting. (F and G) Representative examples and summary of p-Erk expression in FO and MZ B cells from control and Fcgr2b-cKO mice; cells were stimulated with intact anti-IgM as described in B–D. (H–J) PBMCs from healthy donors were stimulated with 15 μg/mL intact anti-IgM or equimolar concentrations (10 μg/mL) of Fab′2 anti-IgM for 60 minutes, after which the phosphorylation of signaling molecules was analyzed by Phosphoflow. (H) Representative example of Syk and Erk phosphorylation in MZ-like B cells. (I and J) Comparison of intact versus Fab′2 anti-IgM in naive and MZ-like B cells. The median percentage of inhibition calculated per donor is indicated. (K–M) Calcium flux following 75 μg/mL intact anti-IgM or equimolar concentrations (50 μg/mL) of Fab′2 anti-IgM. Peak calcium flux and the AUC were calculated using FlowJo. (K) Representative examples of calcium flux in naive and MZ-like B cells. (L and M) Comparison of the peak and AUC of calcium flux following intact versus Fab′2 anti-IgM in naive and MZ-like B cells. inh, inhibition. Data are shown as the median, with each symbol representing an individual mouse (n = 4–7 mice per group for B–D; n = 8 mice per group for G; n = 6 mice per group for H–J; n = 5 mice per group for L and M; data for each were pooled from 2–3 independent experiments). *P < 0.05, **P < 0.01, and ***P < 0.001, by 2-way ANOVA with Bonferroni’s post hoc test.

