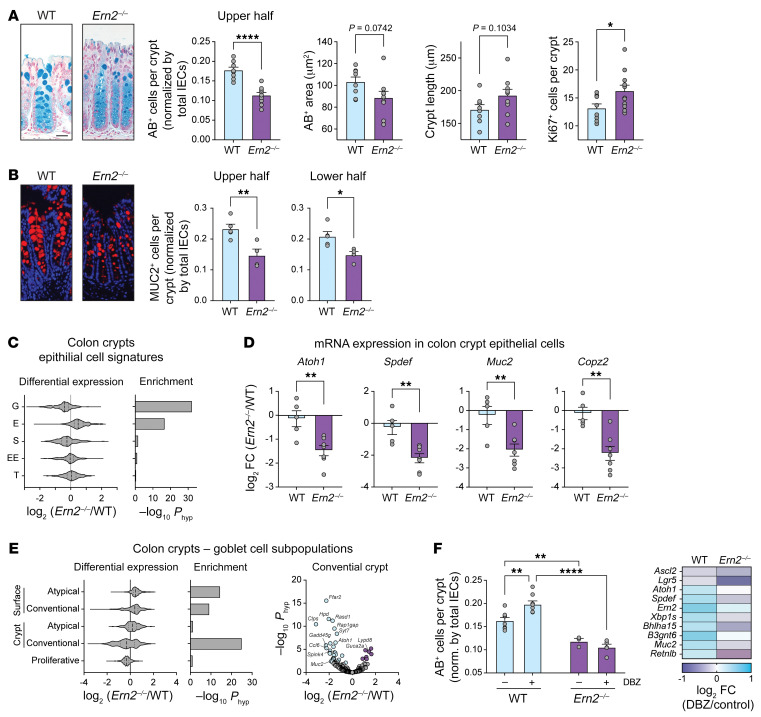
Figure 1. Ern2–/– mice have fewer goblet cells in distal colon under CONV conditions.
(A and B) Representative images of (A) AB-stained and (B) anti-MUC2 antibody–stained sections of distal colon from CONV-WT and CONV-Ern2–/– mice. Bar graphs show AB+ cells and MUC2+ cells in the upper and lower half of crypts (normalized by number of crypt epithelial cells), AB-stained theca area, crypt length, and KI67+ cells per crypt in distal colon of WT and Ern2–/– littermates. Symbols represent average values for individual mice (WT, n = 8; Ern2–/–, n = 9) from 2 independent cohorts. Data are represented as mean ± SEM. Mean values were compared by unpaired t test. Scale bars: 50 μm. (C) Violin plot shows the distribution of relative mRNA expression of epithelial cell signature genes (2) in colon crypts. G, goblet; E, enterocyte; S, stem; EE, enteroendocrine; T, tuft. Bar graph shows enrichment of differentially expressed genes. (D) Bar graphs show relative mRNA expression in colon crypts measured by qPCR. Symbols represent individual mice, and data are represented by mean ± SEM. Mean values were compared by unpaired t test. (E) Left panels: Violin plot shows the distribution of relative mRNA expression for genes in goblet cell subpopulations (3), and bar graph shows enrichment of differentially expressed genes. Right panel: volcano plot shows differential expression of conventional crypt goblet cell genes. (F) Bar graph shows the number of AB+ cells in upper half of crypts (normalized by number of crypt epithelial cells) for mice treated with or without the γ-secretase inhibitor DBZ. Symbols represent the average values for individual mice, and data are represented as mean ± SEM. Mean values were compared by 2-way ANOVA (n = 4–8 mice per group). Heatmap shows differential mRNA expression in colon epithelial cells measured by qPCR. *P < 0.05; **P < 0.01; ****P < 0.0001.

