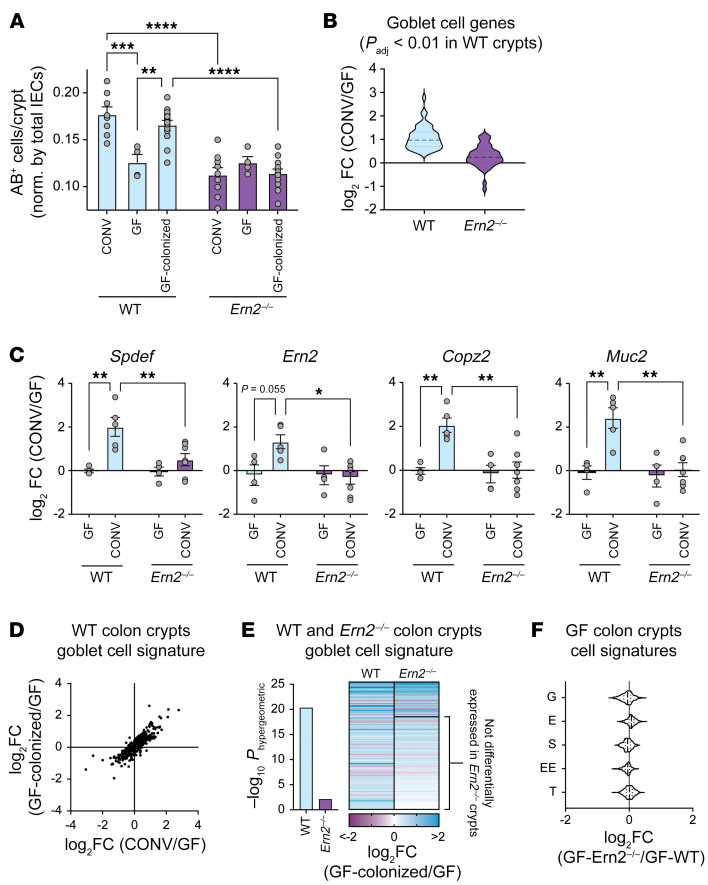
Figure 2. Gut microbes induce colon goblet cell development in an ERN2-dependent manner.
(A) Bar graph shows the number of AB+ cells in the upper half of crypts in the distal colon of WT and Ern2–/– under CONV conditions, GF conditions, and GF followed by colonization with gut microbes from CONV-WT donor mice (Colonized). Symbols represent the average value for an individual animal, and data are represented as mean ± SEM. Mean values were compared by 2-way ANOVA. Data for CONV mice is from Figure 1A. (B) Violin plot showing relative mRNA expression for goblet cell signature genes upregulated in CONV-WT mice compared with GF-WT mice. Relative expression for those same genes is plotted for Ern2–/– mice. (C) Bar graphs show relative mRNA expression in colon crypts from WT and Ern2–/– mice for select genes measured by qPCR. Symbols represent individual mice, and data are represented as mean ± SEM. Mean values were compared by 2-way ANOVA. (D) Scatter plot compares differential expression of goblet cell signature genes for CONV-WT versus GF-WT compared with COLONIZED-WT versus GF-WT. (E) Bar graph shows enrichment of differentially expressed goblet cell signature genes for COLONIZED-WT and COLONIZED-Ern2–/– mice compared with GF controls. The heatmap shows the relative expression of differentially expressed genes. The subset of the genes not differentially expressed (Padj > 0.01) in Ern2–/– mice is indicated. (F) Violin plot showing the relative mRNA expression of epithelial cell signature genes from colon crypts of GF-Ern2–/– mice compared with GF-WT mice. *P < 0.05; **P < 0.01; ***P < 0.001; ****P < 0.0001.

