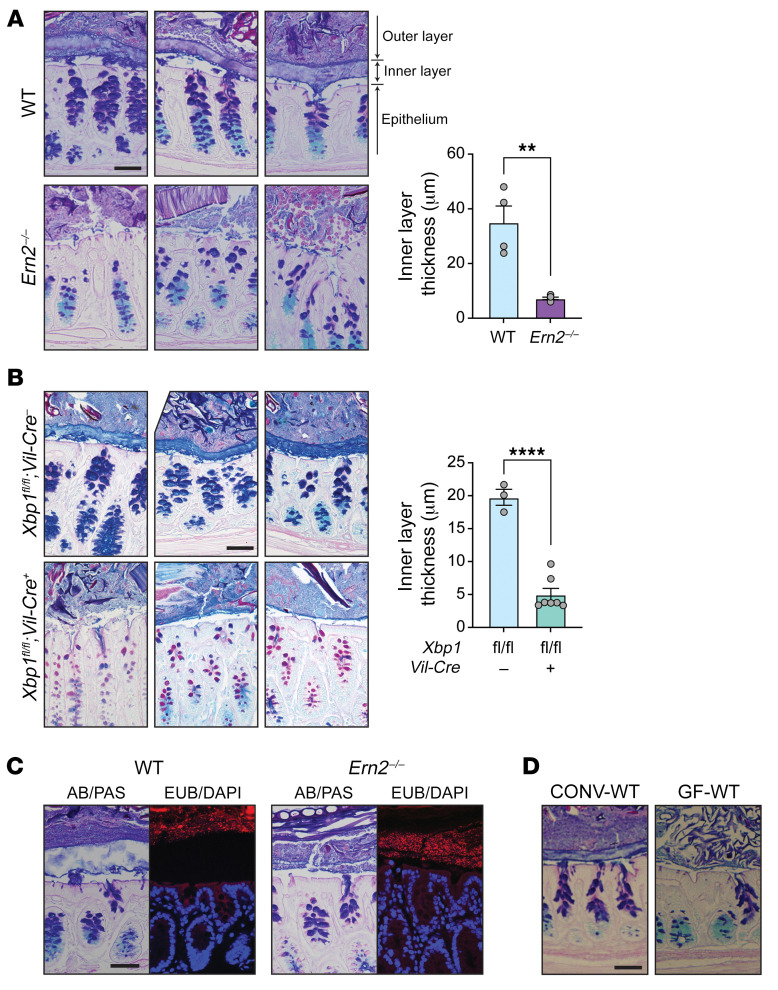
Figure 4. Impaired assembly of the colon mucus layer in Ern2–/– mice.
Representative images of the colon mucus layer assessed by AB/PAS staining of Carnoy’s fixed tissue from (A) CONV-WT and CONV-Ern2–/– mice and (B) Xbp1fl/fl;Vil-Cre– and Xbp1fl/fl;Vil-Cre+ mice. Bar graphs show the thickness of the inner mucus layer. Symbols represent the average value of the distribution of measures around at least 2 full cross sections for individual mice (WT, n = 4; Ern2–/–, n = 5; Xbp1fl/fl;Vil-Cre–, n = 3; Xbp1fl/fl;Vil-Cre+, n = 7). Data are represented as mean ± SEM. Mean values were compared by unpaired t test. **P < 0.01; ****P < 0.0001. (C) Representative images of Carnoy’s fixed colon tissue from CONV-WT and CONV-Ern2–/– mice stained with AB/PAS or the 16S rRNA in situ hybridization probe EUB338 (red) to detect lumenal bacteria. Nuclei were stained with DAPI (blue). (D) Representative images of Carnoy’s fixed tissue from CONV-WT and GF-WT mice stained with AB/PAS. Scale bars: 50 μm.

