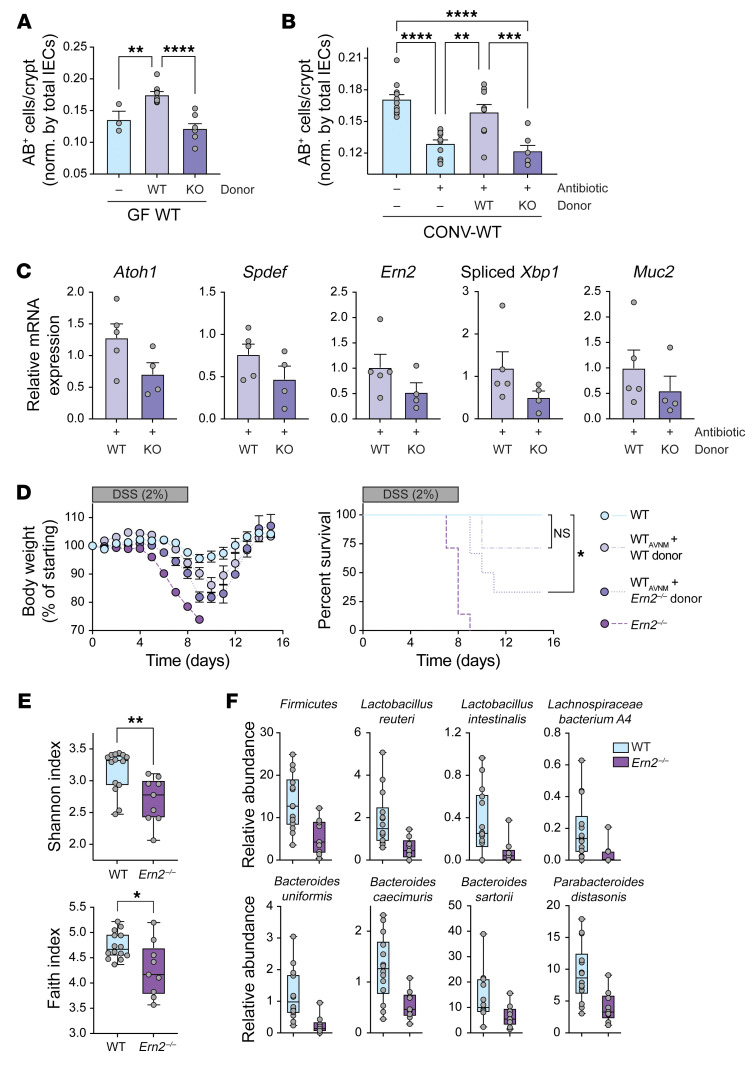
Figure 6. Ern2–/– microbiota are unable to support goblet cell development when transferred into WT recipient mice.
Bar graphs show number of AB+ cells per crypt in the upper half of crypts in the distal colon of (A) GF-WT mice (n = 3) and GF-WT mice colonized with microbiota from WT (n = 9) or Ern2–/– (n = 8) donor mice and (B) CONV-WT mice (n = 11), antibiotic-treated CONV-WT mice (n = 11), and antibiotic-treated CONV-WT mice that were cohoused with WT (n = 9) or Ern2–/– (n = 7) donor mice. Symbols represent individual mice. Data are represented as mean ± SEM. Mean values were compared by 1-way ANOVA. (C) Bar graphs show relative mRNA expression for indicated genes measured by qPCR in colon epithelial cells from antibiotic-treated WT mice that were cohoused with either WT (n = 5) or Ern2–/– (n = 4) donor mice. Expression levels are shown relative to control WT mice (no antibiotics, no cohousing). (D) Time courses show (left panel) change in body weight and (right panel) survival during administration of DSS for 8 days followed by 14 days of recovery for WT (n = 6), Ern2–/– (n = 7), and antibiotic-treated WT mice cohoused with WT (n = 7) or Ern2–/– donors (n = 6). Survival curves were compared using log rank test. (E) Box plots show α diversity indices for microbiota from WT and Ern2–/– mice. Symbols represent values for individual mice, and error bars represent minimum and maximum. (F) Box plots show relative abundance data for indicated taxa that are significantly different between microbiota from CONV-WT and CONV-Ern2–/– mice. Symbols represent relative abundance for an individual mouse. FDR q values were calculated with MaAsLin2 (63) (WT, n = 14; Ern2–/–, n = 9). *P < 0.05; **P < 0.01; ***P < 0.001; ****P < 0.0001.

