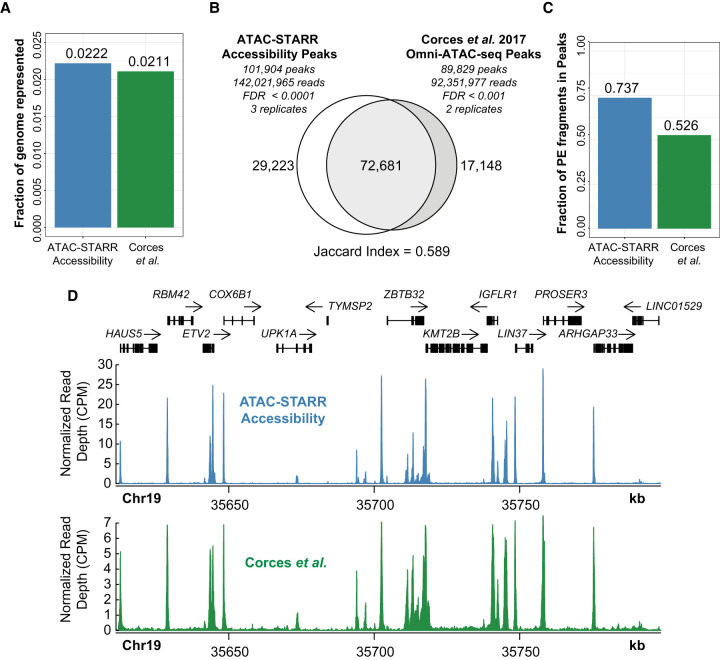
Figure 2.
ATAC-STARR-seq accurately quantifies chromatin accessibility. ATAC-seq data from Corces et al. (2017) is compared with ATAC-STARR-seq plasmid DNA data. (A) Fraction of the human genome represented by each peak set. (B) Venn diagram of peak overlap between the two data sets and the associated Jaccard index. (C) Fraction of paired-end (PE) fragments in peaks—FRiP scores—for both samples. (D) Signal tracks comparing counts per million (CPM) normalized read count at a representative locus.

