Figure 3.
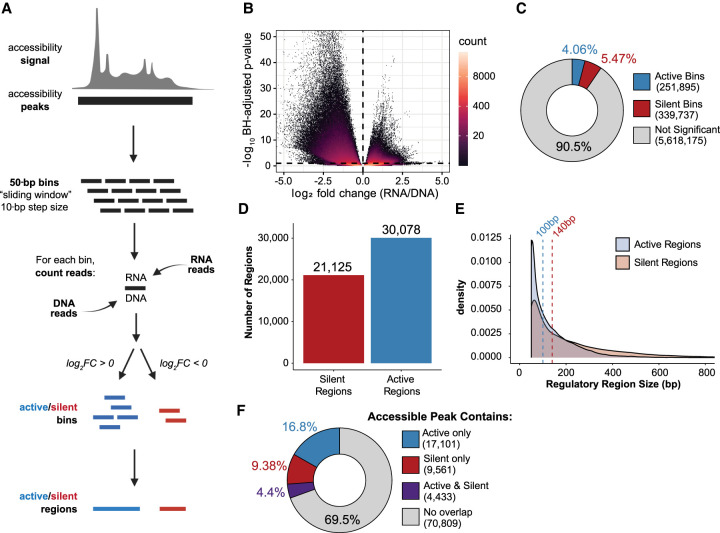
ATAC-STARR-seq quantifies regulatory activity within accessible chromatin. (A) Schematic of the sliding window peak calling method. Accessibility peaks are chopped into 50-bp bins at a 10-bp step size with the BEDTools makewindows function (options -w 50, -s 10). For each window, RNA and DNA reads are counted using Subread's featureCounts function. Differential analysis comparing RNA and DNA read count is performed with DESeq2. Significant bins are called at a Benjamini–Hochberg (BH) adjusted P-value < 0.1 and parsed into active or silent depending on log2 fold-change (FC) value (± zero). Finally, bins are collapsed into regions using the BEDTools merge function. Log2FC scores are averaged across merged bins. (B) Volcano plot of log2FC scores against –log10-transformed BH adjusted P-value from DESeq2 for all bins analyzed. (C) The proportion of bins called as active or silent. (D) The number of regions defined as either active or silent. (E) Overlapping density plots of active and silent regulatory region size; dashed lines represent the medians in each case. (F) The proportion of accessible peaks that overlap an active or silent region, or both.

