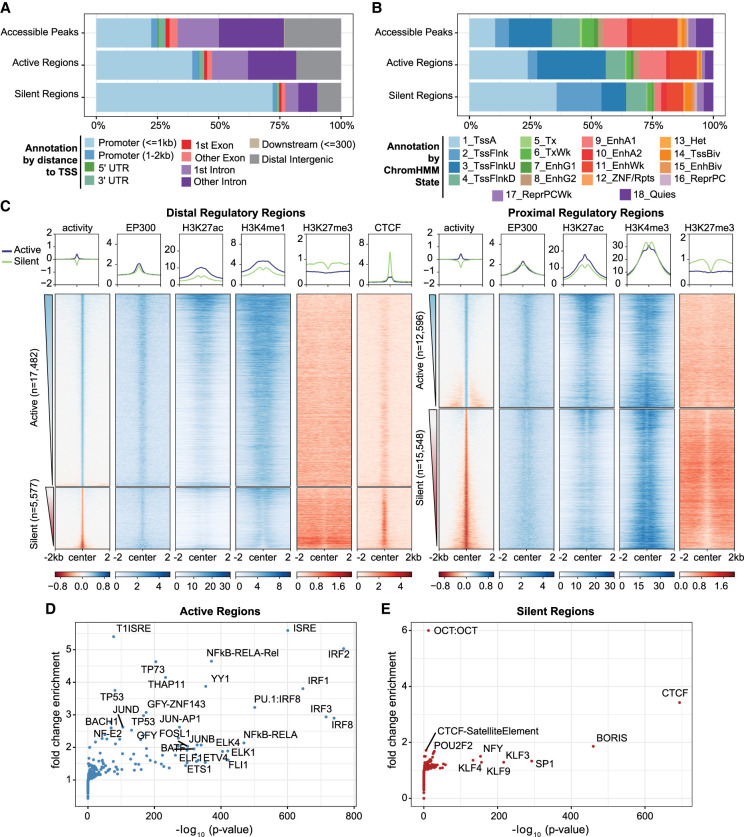
Figure 4.
Regulatory regions defined by ATAC-STARR exhibit annotations, histone modifications, and TFs characteristic of their function. (A) Annotation of regulatory regions relative to the transcriptional start site (TSS). The promoter is defined as 2 kb upstream and 1 kb downstream of the TSS. (B) Annotation of regulatory regions by the ChromHMM 18-state model for GM12878 cells. (C) Heat maps of GM12878 ENCODE ChIP-seq signal and regulatory activity for proximal and distal ATAC-STARR-defined regulatory regions. Proximal regions were classified as within 2 kb upstream and 1 kb downstream of a TSS; all other regions were annotated as distal. Active and silent regions were ranked by mean activity signal for both proximal and distal regions. (D,E) Transcription factor motif enrichment analysis as quantified by HOMER. Fold-change values are relative to the default background calculated by HOMER.

