Figure 5.
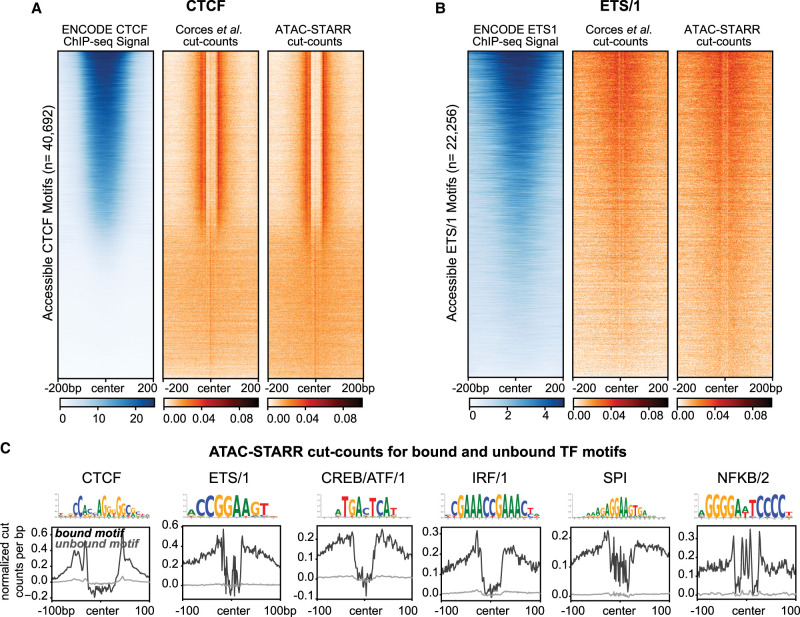
ATAC-STARR-seq identifies transcription factor footprints. (A) Comparison of ENCODE CTCF ChIP-seq signal to Corces et al. (2017) and ATAC-STARR-seq cut count signal for all accessible CTCF motifs. (B) Comparison of ENCODE ETS1 ChIP-seq signal to Corces et al. (2017) and ATAC-STARR-seq cut count signal for all accessible motifs with the ETS/1 motif archetype. For both, regions were ranked by largest mean ChIP-seq signal. (C) Aggregate plots representing mean signal for the TOBIAS-defined bound and unbound motif archetypes: CTCF, ETS/1, CREB/ATF/1, IRF/1, SPI, NFKB/2.

