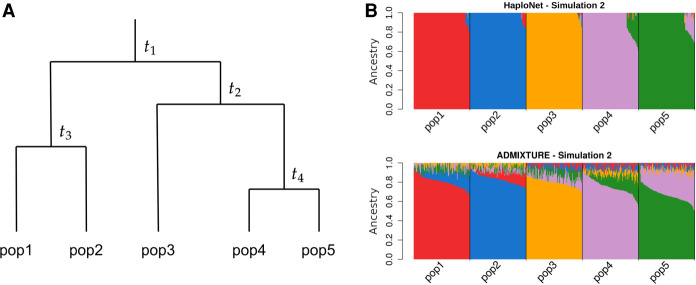
Figure 1.
Inference of population structure in different simulation configurations. (A) Overview of simulation configuration of four splits into five populations with equal population sizes at all times. The time of population splits are designated t1, t2, t3 and t4, measured in generations. (B) Estimated ancestry proportions in one of the four simulation scenarios (Simulation 2) with t1 = 200, t2 = 120, t3 = 80, and t4 = 40 using HaploNet (top) and ADMIXTURE (bottom).

