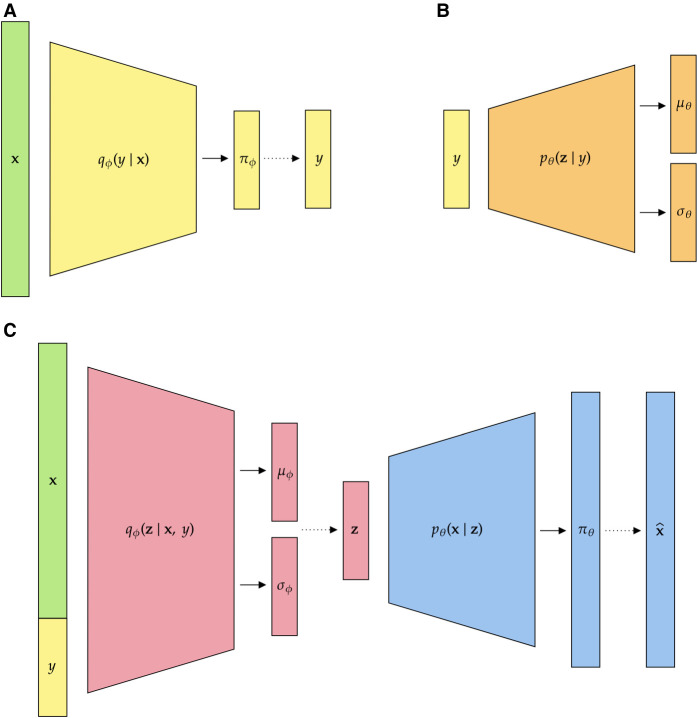
Figure 5.
The NN architecture of HaploNet split into three major substructures. Here the solid lines represent the estimation of distribution parameters, and the dashed lines represent sampling of latent variables. (A) The NN parameterizing the distribution , for sampling the haplotype cluster; (B) the network parameterizing the regularizing distribution of the sampled encoding, ; and (C) the network parameterizing the distribution , for sampling the haplotype encoding, as well as the network decoding the sampled encoding to reconstruct our input. Note that the colors of the network blocks are coherent across substructures such that the sampled y in A is used in both B and C.

