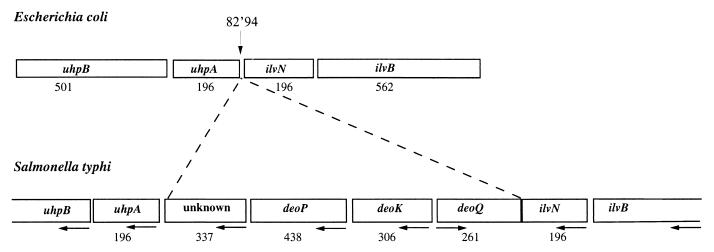
FIG. 2.
Organization of the deoK region in the serovar Typhi genome and comparison with the equivalent region on E. coli genome. Boxes correspond to genes, and numbers below boxes indicate the size of the gene product (number of amino acid residues). Horizontal arrows indicate the directions of transcription, and the vertical arrow locates the deleted locus on the genome of E. coli.

