Figure 8.
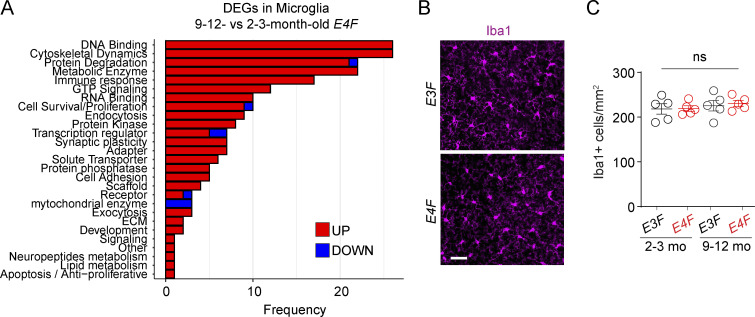
APOE4 effects on microglia transcriptome. (A) Bar charts reporting the number of DEGs encoding for proteins with known function in each functional class, as exclusively identified in microglia (n = 219 DEGs) of 9–12- vs. 2–3-mo-old E4F mice only, but not in 9–12- vs. 2–3-mo-old E3F mice. All data are from four mice per group. (B and C) Representative images of Iba1+ microglia in the cortex (scale bar = 50 µm; B) and quantification of Iba1+ cortical astrocytes in 2–3- and 9–12-mo-old E3F and E4F mice (C). Mean ± SEM, n = 5 mice per group. Significance by one-way ANOVA followed by Bonferroni post hoc test.

