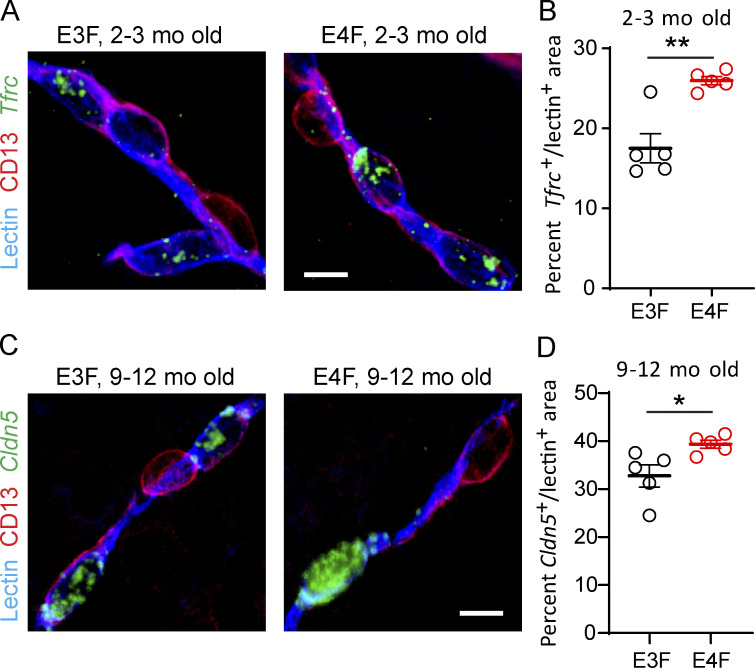
Figure S2.
Validation of snRNA-seq endothelial DEGs by FISH in E4F compared with E3F mice. (A and B) Representative FISH of Tfrc (green) in lectin+ endothelial profiles (blue), but not in CD13+ PCs (magenta) in the cortex of 2–3-mo-old E3F and E4F mice (A, bar = 10 µm), and quantification of percentage lectin+ area colabeled with Tfrc in 2–3-mo-old E3F and E4F mice (B). The percentage increase in Tfrc+ lectin+ area by FISH in E4F compared with E3F mice was 48%, and the Tfrc log2(fold-change) = 0.598 for E4F compared with E3F mice by RNA-seq analysis (see Table S1 A). (C and D) Representative FISH of Cldn5 (claudin 5; green) in lectin+ endothelial profiles (blue), but not in CD13+ PCs (magenta) in the cortex of 9–12-mo-old E3F and E4F mice (C; bar = 10 µm), and quantification of percentage lectin+ area colabeled with Cldn5 in 9–12-mo-old E3F and E4F mice (D). The percentage increase in Cldn5+ lectin+ area by FISH in E4F compared with E3F mice was 20%, and the Cldn5 log2(fold-change) = 0.295 for E4F compared with E3F mice by RNA-seq analysis (see Table S1 B). In B and D, mean ± SEM, n = 5 mice; significance by unpaired t test. *, P < 0.05; **, P < 0.01.

