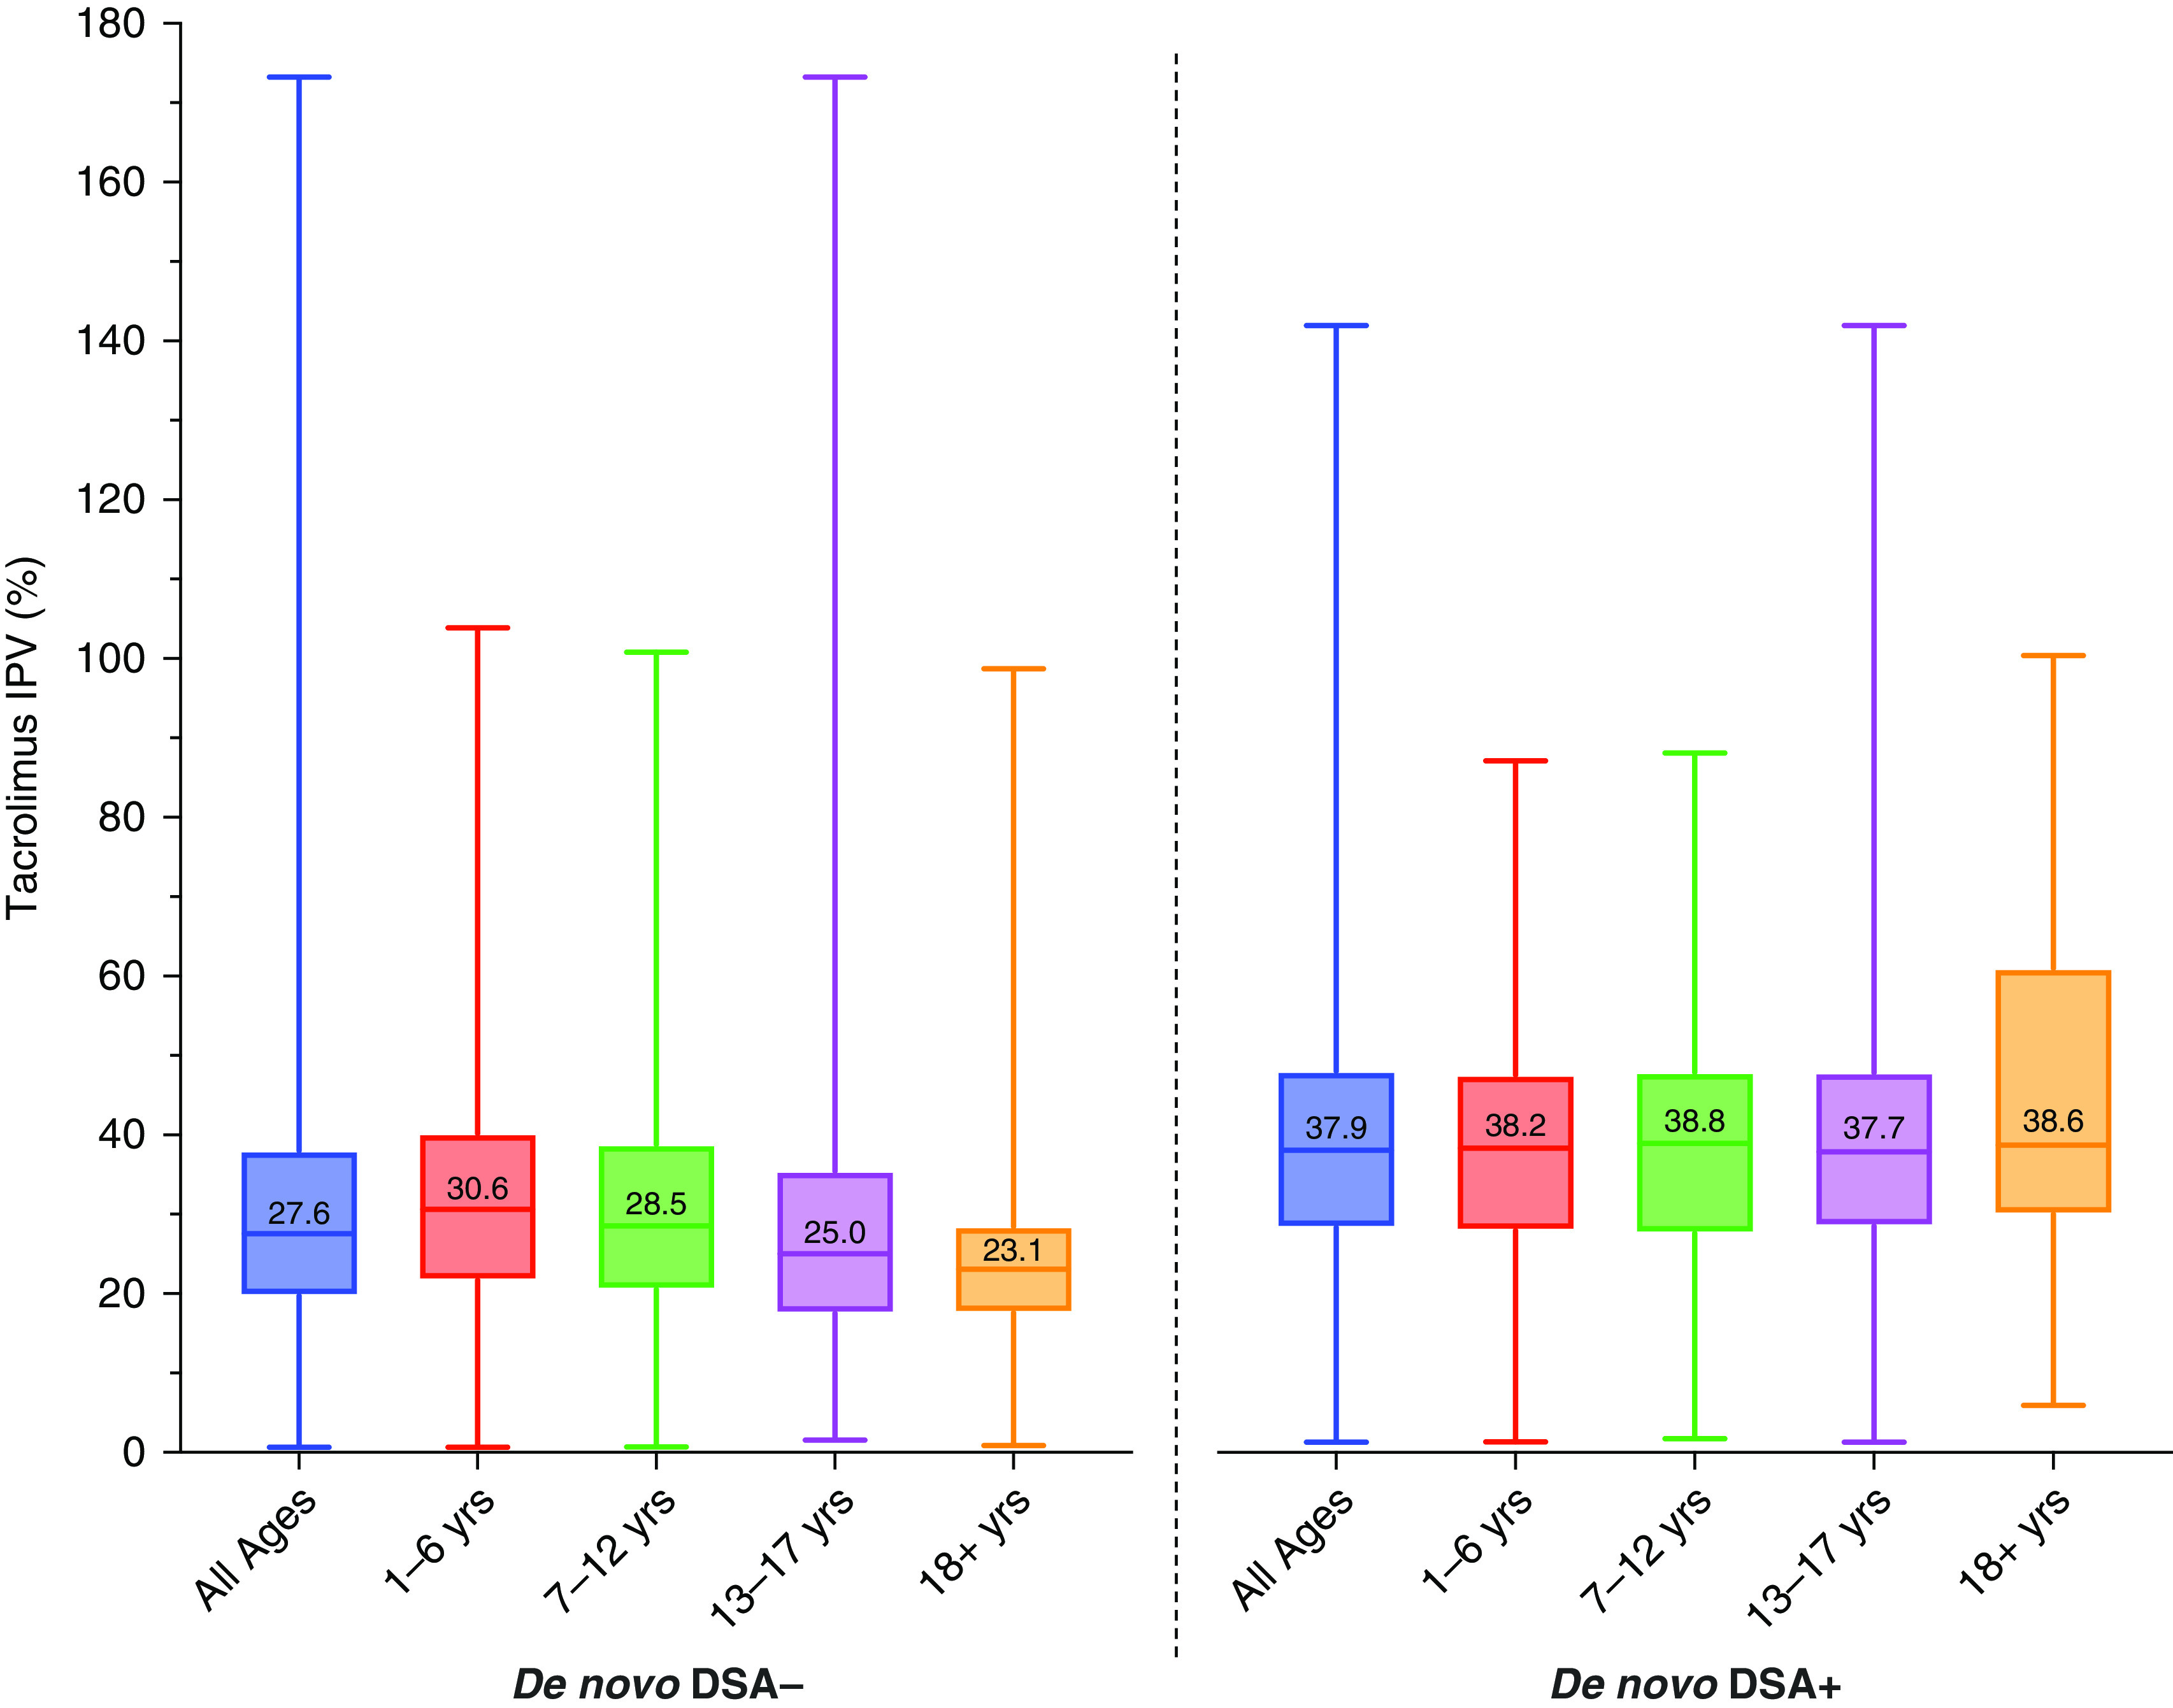
Figure 4.

Box plots depicting distribution of tacrolimus IPV by de novo DSA status and stratified by age group. Tacrolimus IPV for non-DSA formers (de novo DSA−) is compared with tacrolimus IPV for patients who formed C1q-binding de novo DSAs (de novo DSA+) and is stratified by age groups of 1–6, 7–12, 13–17, and 18+ years (n=200), with median tacrolimus IPV values displayed. Only patients who formed de novo DSA+ at least 10 months post-transplant were included in the de novo DSA group. Tacrolimus IPV was calculated starting from 10 months post-transplantation. The P value was <0.001 for comparisons between de novo DSA− and de novo DSA+ groups for all ages and for each set of age groups by the Mann–Whitney U test.
