Figure S1.
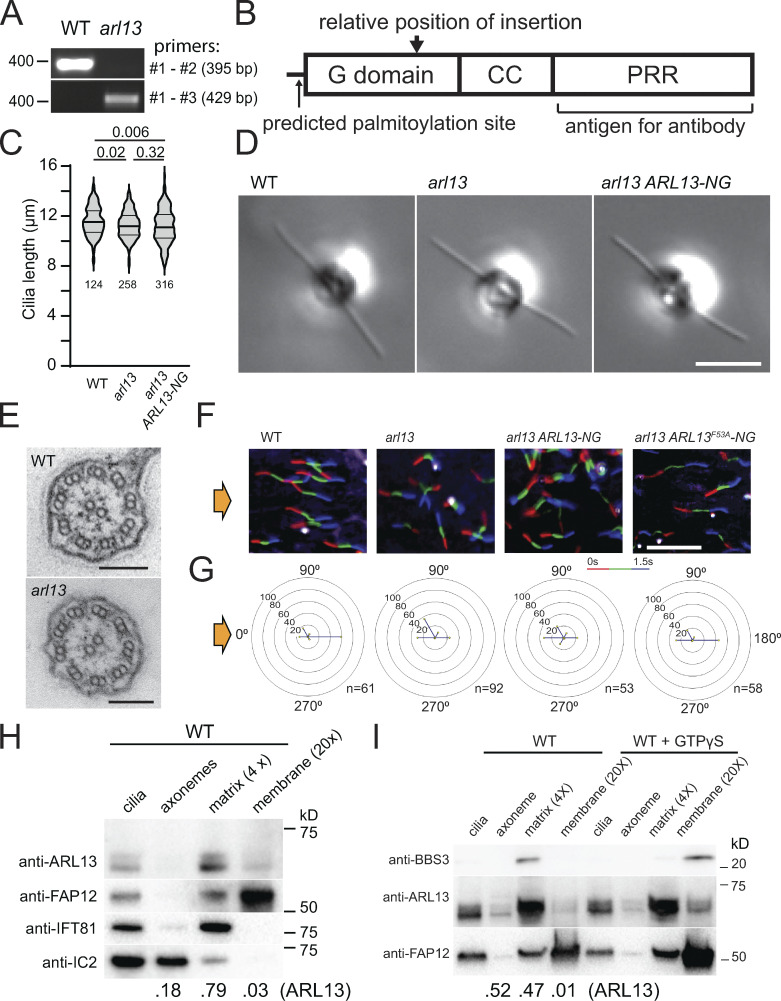
ARL13 is a ciliary matrix protein. (A) PCR products from WT or arl13 genomic DNA. The expected product size and the position of the nearest DNA size marker are indicated. The positions of the primers are marked in Fig. 1 A. (B) Schematic presentation of ARL13 protein showing its G domain, coiled coil (CC) domain, and proline rich region (PRR). The predicted site of palmitoylation (C12), the position corresponding to the site of the insertion in arl13, and the region used for antibody production are marked. (C) Violin plot of the ciliary lengths of control (g1, WT), arl13, and arl13 ARL13-NG cells. The number of cilia analyzed and the P values of a two-tailed t test are indicated. (D) DIC image of live control (g1, WT), arl13, and arl13 ARL13-NG cells. Bar = 10 µm. (E) TEM images of control (g1, WT) and arl13 cilia in cross section. Bar = 100 nm. (F and G) Single cell motion analysis of the control (g1, WT), arl13, and arl13 ARL13-NG and arl13 ARL13F53A-NG strains. The direction of light is indicated (yellow arrows). (F) Composite micrographs showing the tracks of individual cells. Each of the three frames taken during a 1.5 s period was assigned a different color in the order red (first image), green, blue (last image) to visualize the swimming direction. Bar = 100 µm. (G) Radial histograms showing the percentage of cells swimming in a particular direction (six bins of 60° each). (H) Western blot of isolated control cilia and ciliary fractions probed with antibodies against ARL13, the membrane protein FAP12, the matrix protein IFT81, and the axonemal IC2. The numbers at the bottom indicate the distribution of ARL13 based on the band intensities of the axonemal, matrix, and membrane fractions. Note that some IFT81 is present in the axonemal fraction and some FAP12 in the matrix fraction indicating that the extraction with Triton X-114 and the phase separation were incomplete. (I) Western blot of isolated ciliary samples and ciliary fractions from wild-type cells probed with antibodies against BBS3, ARL13, and FAP12. Triton X-114 phase partitioning was carried out with and without GTPγS as indicated. The numbers at the bottom indicate the distribution of ARL13 based on the band intensities. Source data are available for this figure: SourceData FS1.

