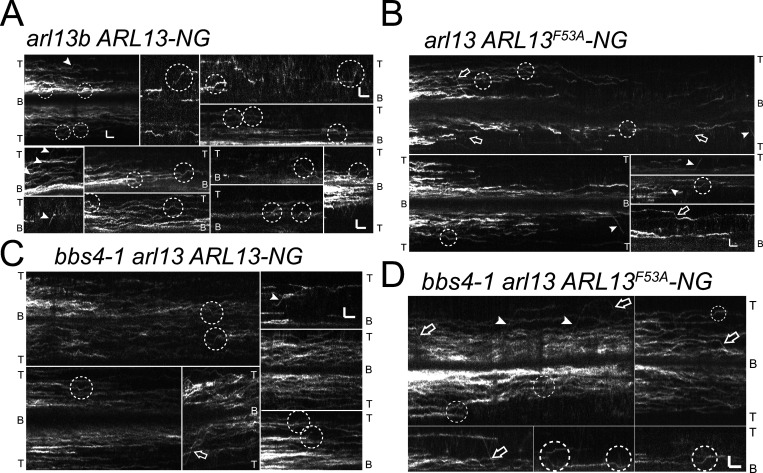
Figure S4.
IFT of ARL13-NG. (A–D) Compilation of kymograms showing the behavior of ARL13-NG (A and C) and ARL13F53A-NG (B and D) in arl13 (A and B) and bbs4-1 arl13 (C and D) cilia. IFT events are in marked by arrowheads (anterograde) and arrows (retrograde). The dashed circles indicate putative IFT events and/or IFT-like movements. The tips (T) and bases (B) of the cilia are indicated. Bars = 2 s and 2 µm.

