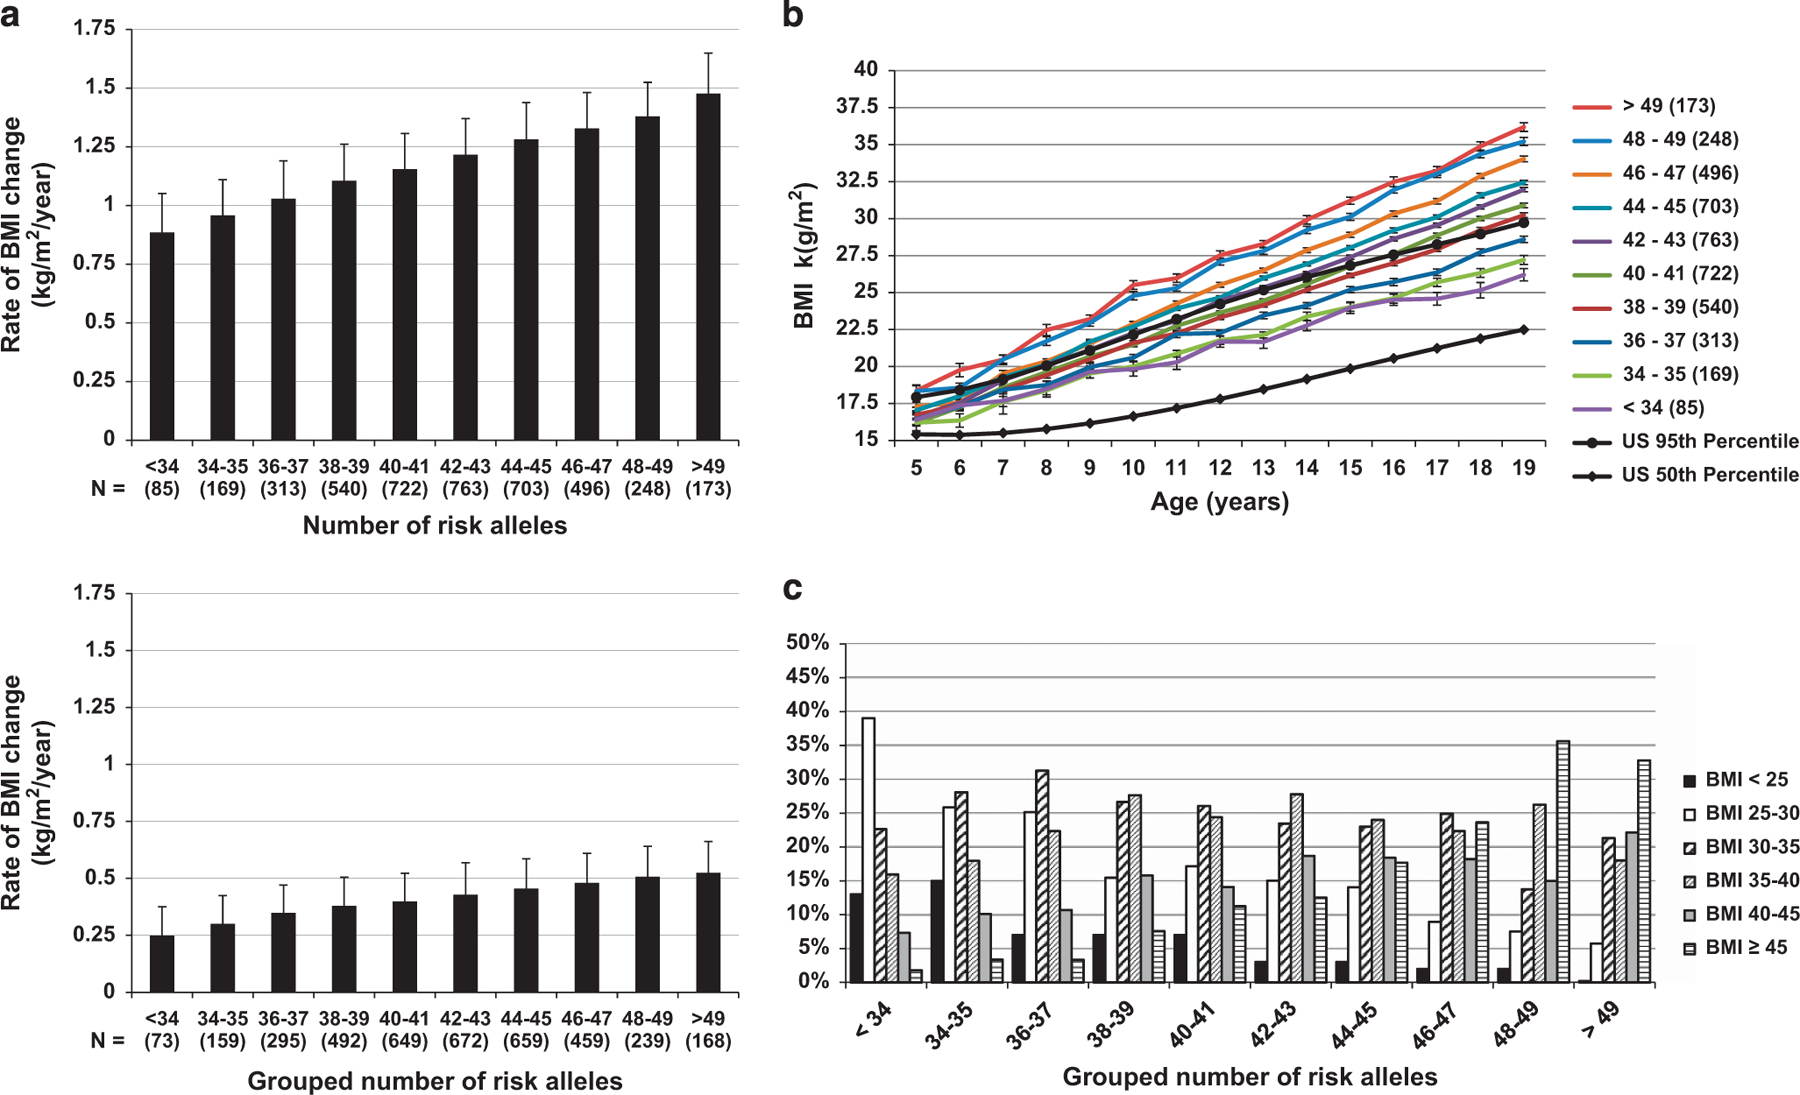
Figure 1.

(a) Rate of BMI change in childhood and adulthood increases with increasing childhood-ARS. The rate of BMI change in childhood and adulthood after adjusting for sex, age at first visit, year of birth, degree of European admixture, sibling relationships and time between the first and last visit. Error bars represent s.e.m. (b) BMI trajectories with increasing childhood-ARS score. Black lines represent 50th and 95th percentile of the general US population based on CDC growth charts50. Mean BMI after adjustment for sex, date of birth, individual estimate of European admixture, age at visit, sibling relationships and the effect of time modeled as a linear relationship. Error bars represent s.e.m. Childhood-ARS trajectories are grouped for illustrative purposes. (c) Distribution of maximum adult BMI by number of risk alleles. Distribution of maximum adult BMI by number of risk alleles (grouping is for illustrative purposes only). All the subjects in this analysis were seen in childhood and followed up into adulthood (n = 2488). The average number of visits and age at recording of maximum BMI did not differ between the groups.
