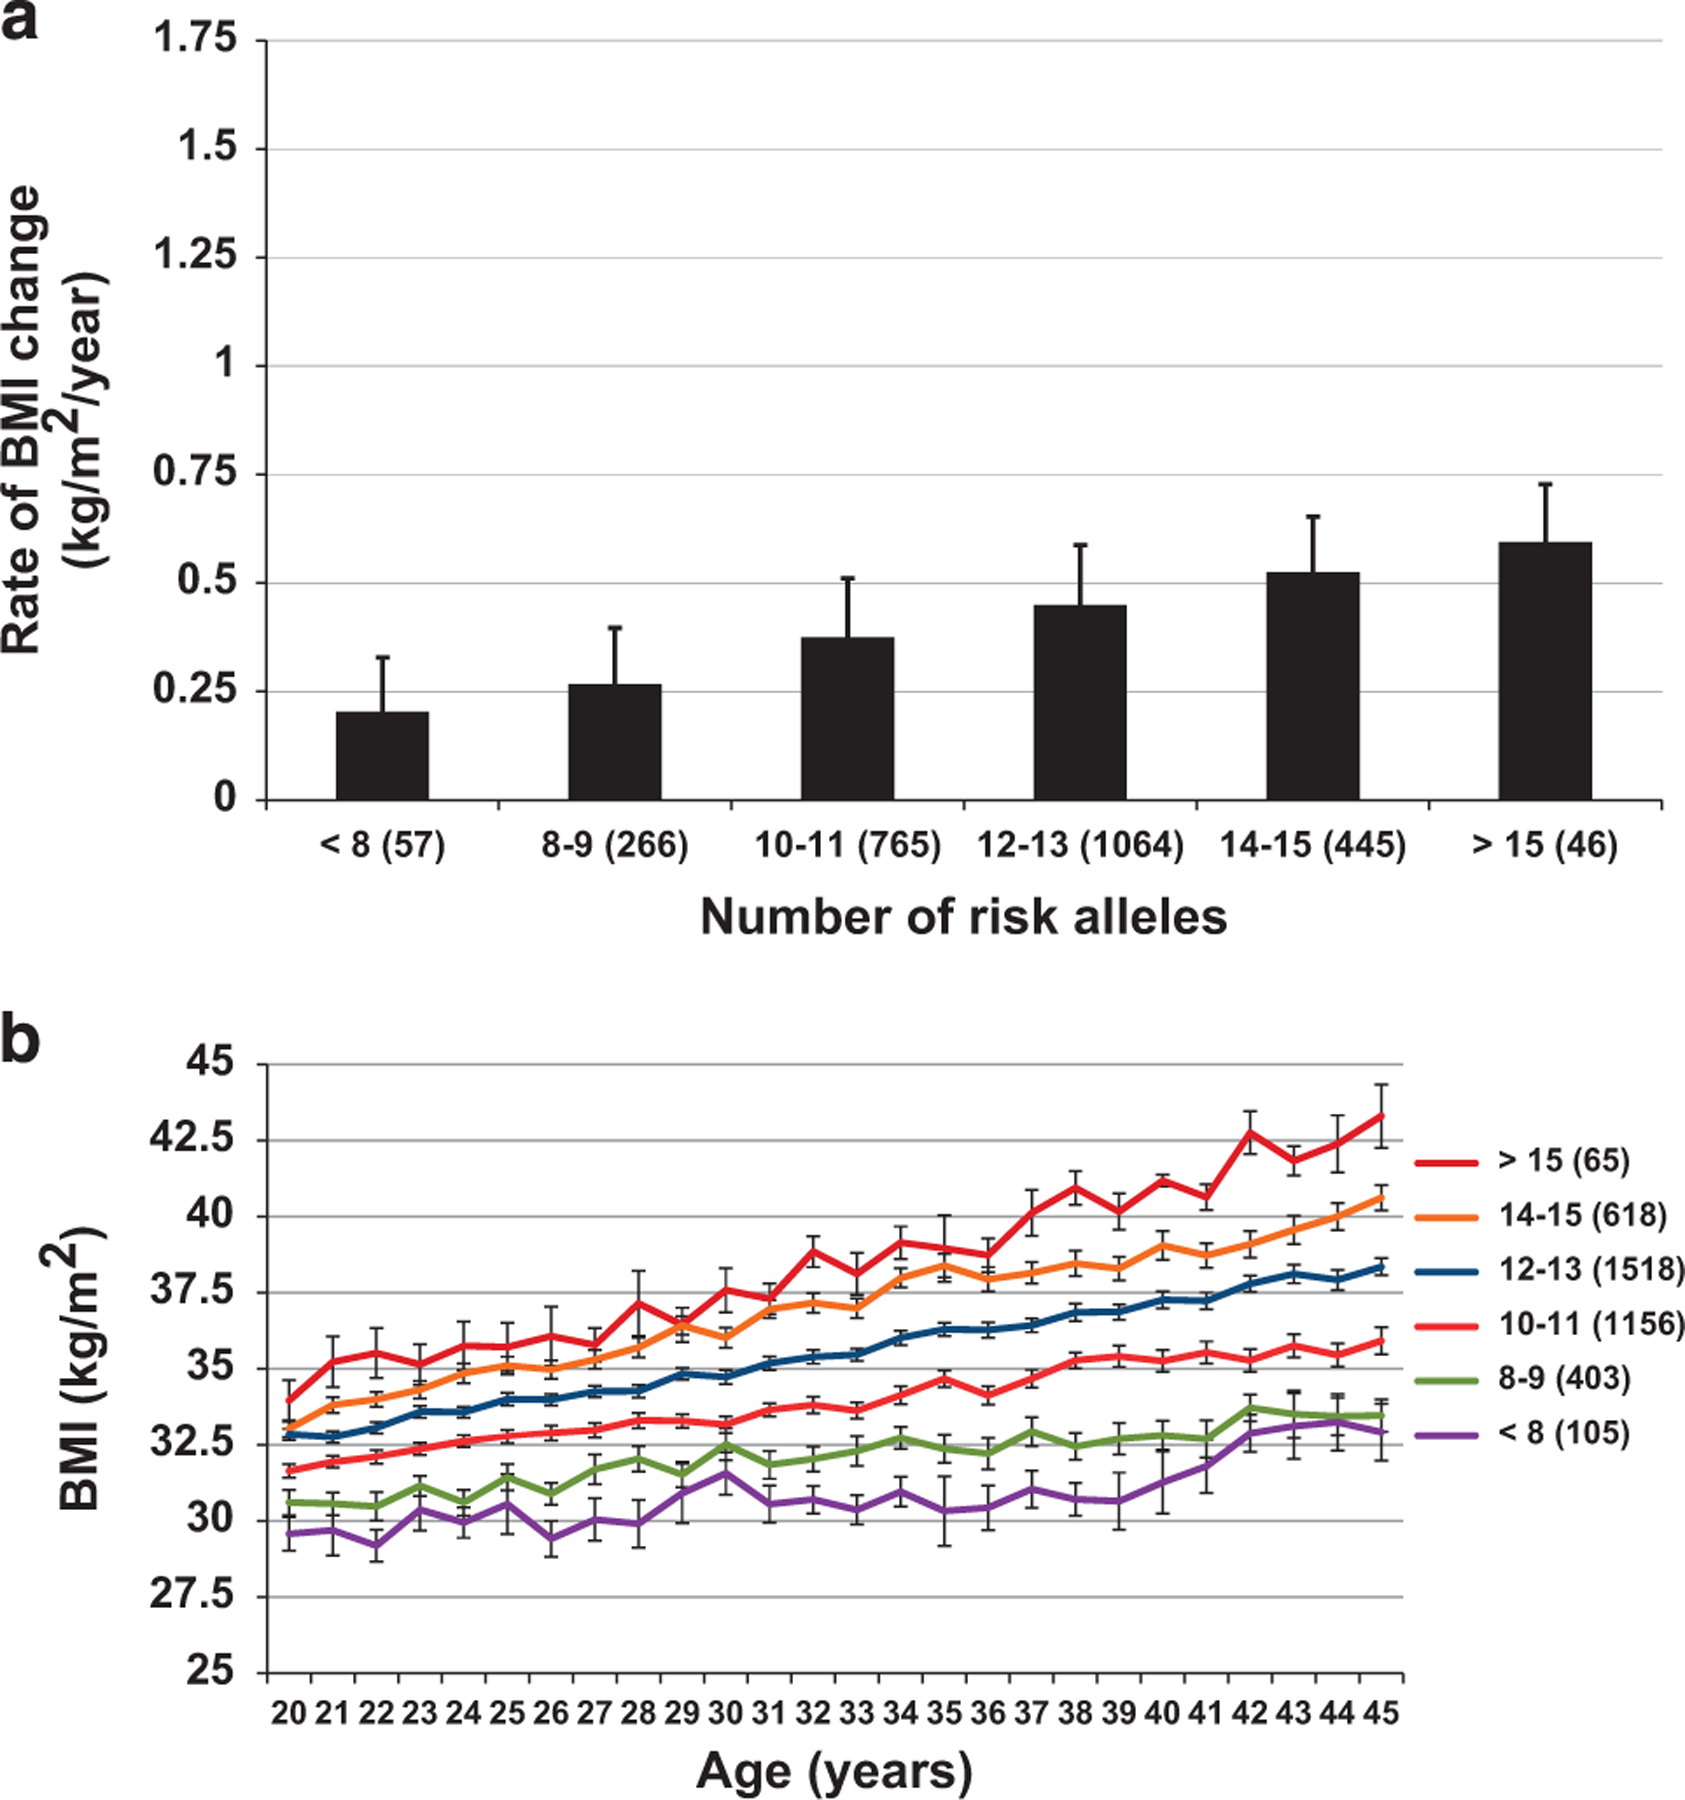
Figure 4.

(a, b) Rate of BMI change and BMI trajectories in adulthood with increasing adult-ARS. (a) Rate of BMI change adjusted for sex, age at first visit, year of birth, degree of European admixture, sibling relationships and time from first to last visit. Adult-ARS was significantly associated with rate of BMI change (0.022 kg m −2 per year per risk allele; 95% CI: 0.016–0.027; P <0.0001). (b) Mean BMI per year after adjustment for sex, date of birth, individual estimate of European admixture, age at visit and sibling relationships and the interaction of age at visit and the risk score modeled as linear relationship. Error bars represent s.e.m.
