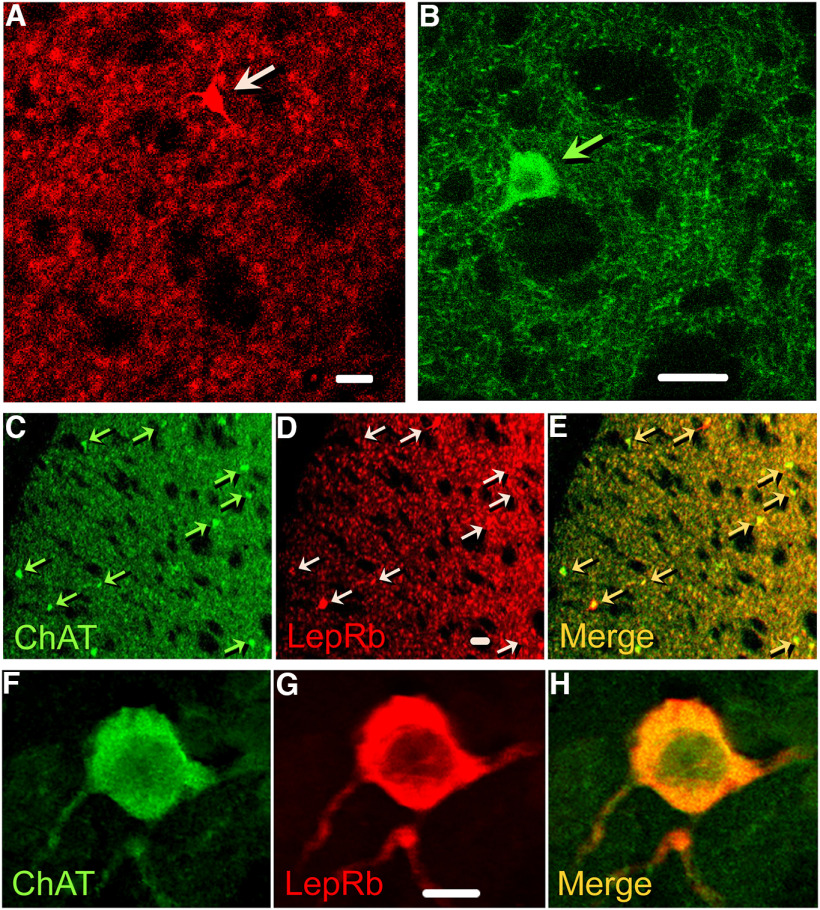
Figure 1.
LepRb expression in the striatum, including in ChI somata and processes. A, LepRb-EGFP-ir in the striatum of LepRbEGFP mice is generally distributed throughout the striatum and is aggregated in clusters of <1 µm to ∼5 µm. A few large neurons also show intense LepRb-EGFP-ir (arrow points to one of these). B, ChAT-ir identifies ChIs in mouse striatum; ChAT-ir is seen in large perikarya (arrow), and also in extensive processes that radiate throughout the striatum. C, Low-magnification (10×) section through dStr from a LepRbEGFP mouse showing widespread ChAT-ir in neuropil, as well as in sparse ChAT-ir ChI somata. D, The same section showing the distribution of LepRb-ir, including LepRb-ir neurons with varying fluorescence intensity. E, Merged image showing co-localization of LepRb-ir and ChAT-ir in somata and processes. C–E, Examples of ChIs expressing LepRb-ir are indicated by arrows. F, High magnification (100×) of a ChAT-ir neuron in dStr from a LepRbEGFP mouse. G, The same neuron showing LepRb-ir throughout the soma and processes. H, Merged image showing co-localization of LepRb-ir and ChAT-ir in the soma and its processes. Images from LepRbEGFP mice are representative of immunostained sections from three animals. Scale bars: 20 µm (A, B, D) and 10 µm (G).

