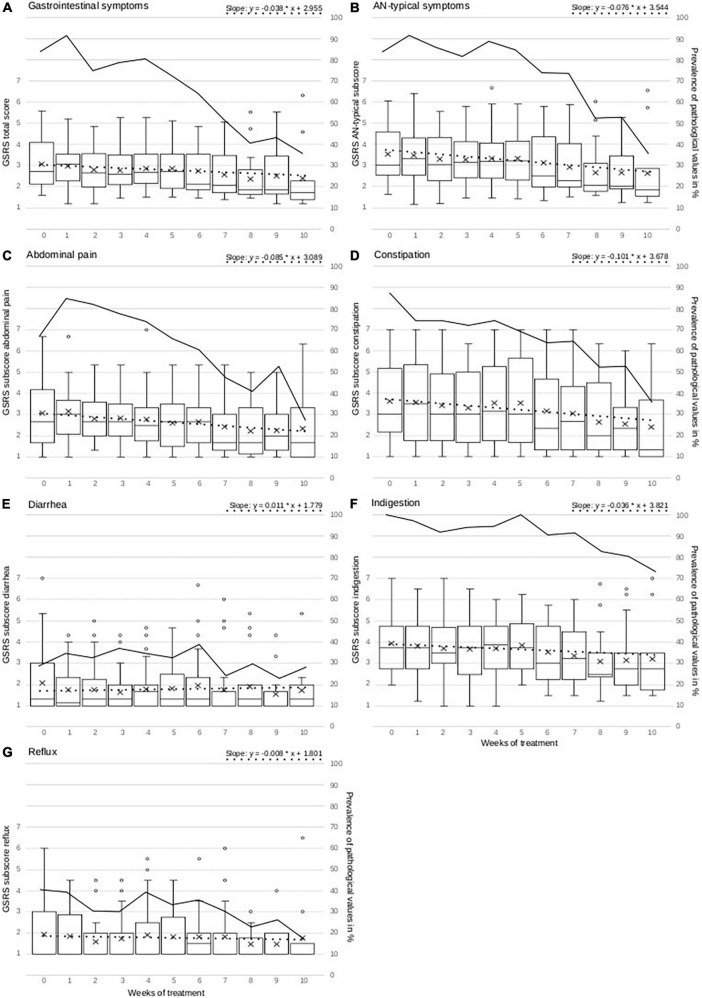
FIGURE 1.
Figure presents weekly measurements of overall GI symptoms, AN-typical GSRS score and GSRS subscales abdominal pain, constipation, diarrhea, indigestion, and reflux as boxplots with mean (+), median (–), interquartile range (IQR = box), whiskers (1.5 × IQR), and outliers (o > 1.5 IQR). The y-axis for all GSRS scores is located on the left of each graph. The dotted line represents the development estimated by mixed linear models for each GSRS score. The mathematical function for this development estimated by mixed linear models is given in the upper right of each separate graph and is constructed with the estimate at admission and the weekly GI change (also see Table 2). In this formula, the x value can be replaced by the treatment week in order to calculate the corresponding estimated GSRS score, which is represented by the y value, for this specific treatment week. The formula is derived from the mixed linear model results, which are presented in Table 2. The continuous line represents the development of the prevalence of pathological GSRS values in % within the examined population. The y-axis of the prevalence is located on the right side of each graph.

