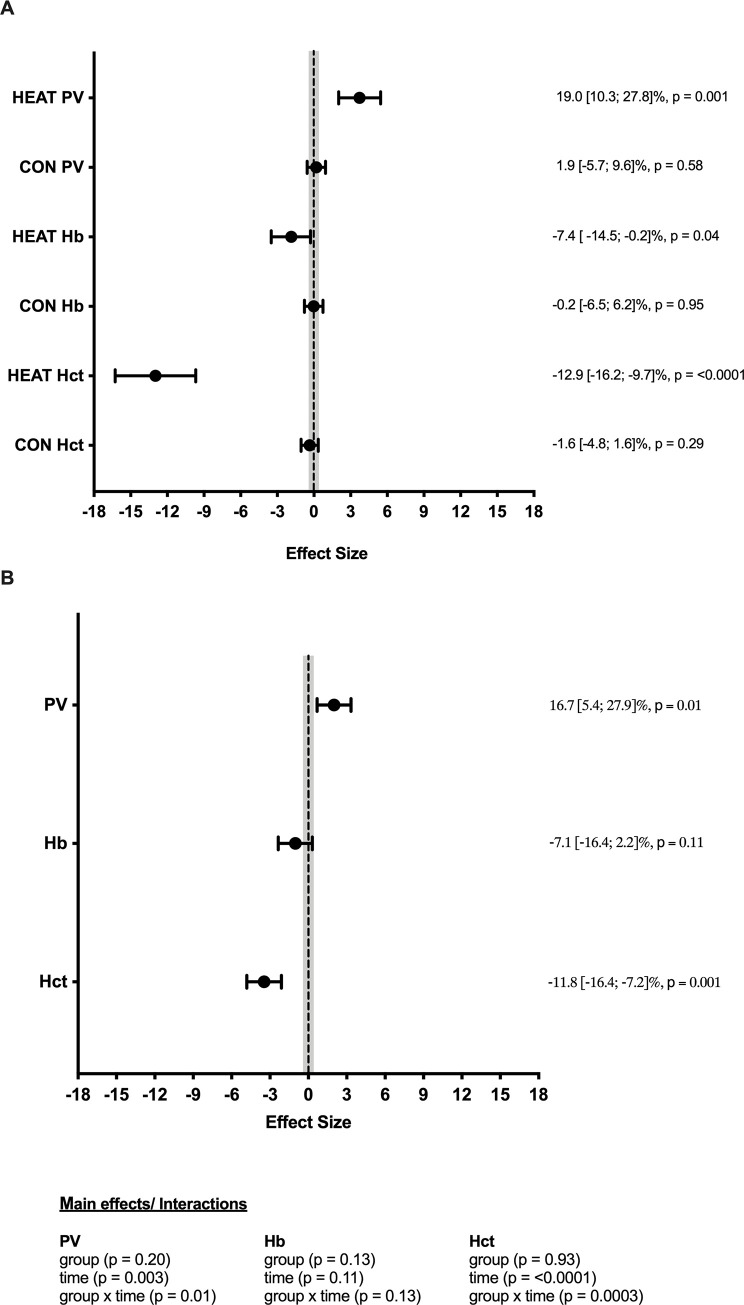
Fig 2.
Within-group (A) and between-group (B) comparison of change in blood parameters pre–post a 10-day heat acclimation protocol in national-level athletes. Shaded area represents trivial change. Percentage change and p-values are reported on the right-hand side for each variable. Main effects and interaction are reported below.

