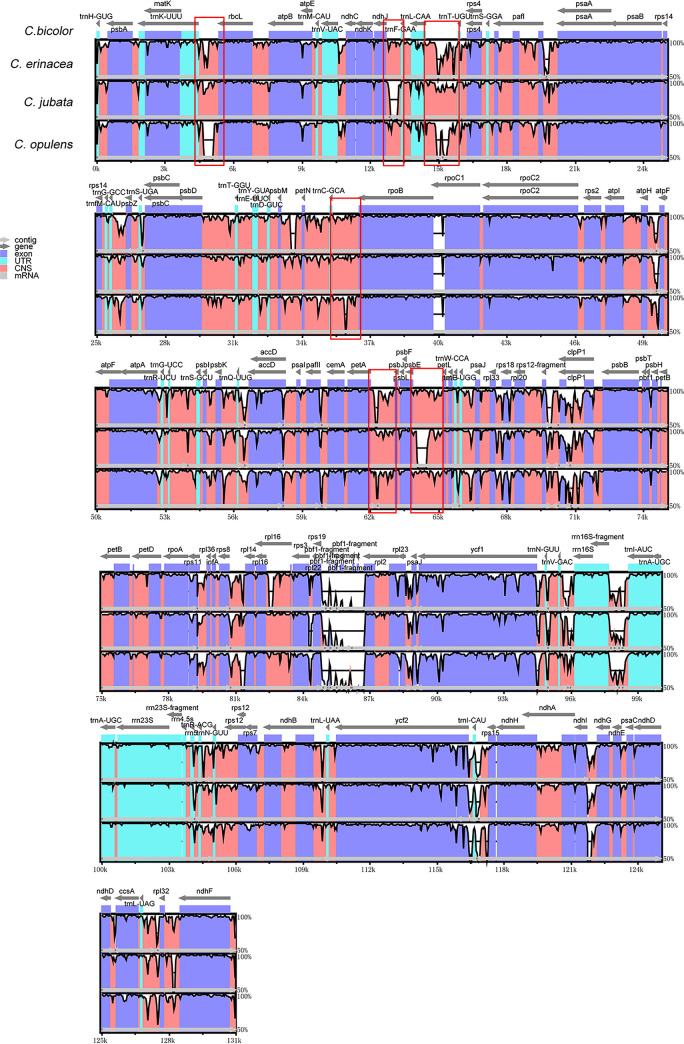
Fig 4. Comparative analyses of genomic differences in chloroplasts of four Caragana species.
Gray arrows and thick black lines above the alignment indicate gene orientation. Purple bars represent exons; blue bars denote untranslated regions (UTRs); pink bars represent non-coding sequences (CNS), and gray bars denote mRNA. The y-axis represents percentage identity.

