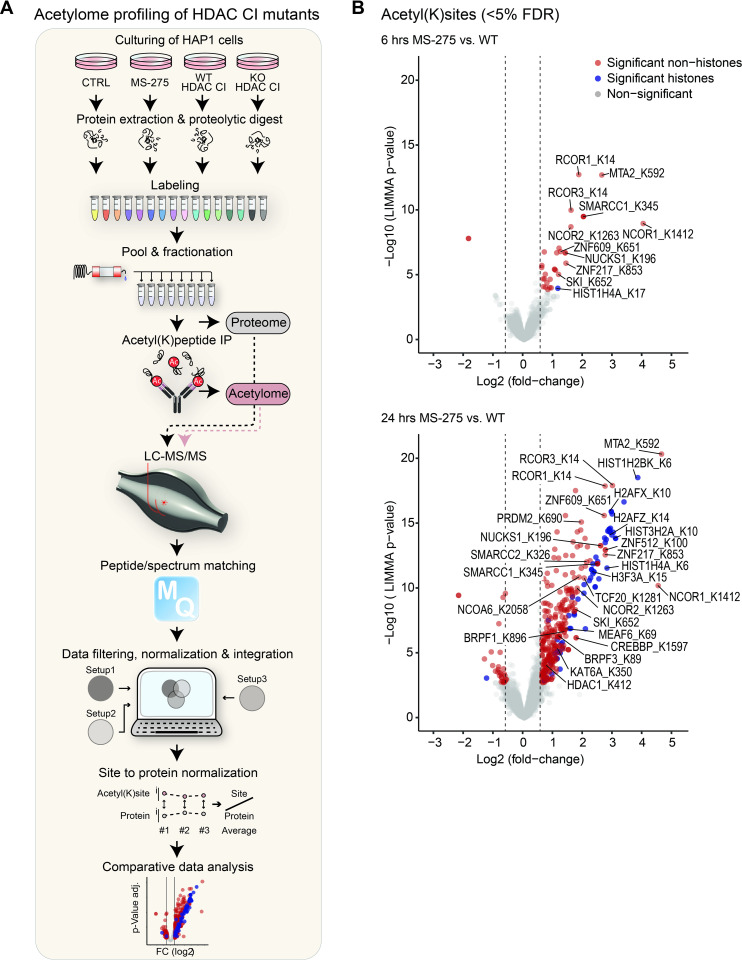
Fig 3. Acetylome analysis for cellular substrate identification of HDAC1/2/3.
(A) Quantitative MS workflow. Cells were lysed and proteins were digested with trypsin. Peptides were labelled using TMTpro 16plex reagents, pooled, and fractionated using high pH HPLC. Aliquots for proteome measurements were removed. Acetylated peptides were purified by acetyl-lysine immunoprecipitation. Proteomes and acetylomes were analyzed by LC-MS/MS. Following data processing, acetylation sites were normalized to protein abundance and the effects of HDAC inactivation were assessed in a comparative analysis. (B) Volcano plots displaying global changes in lysine acetylation, induced by 6 hours (upper panel) and 24 hours (lower panel) of MS-275 treatment. Significantly regulated acetyl(K)sites (≥ 1.5-fold change over wildtype cells (dashed lines), padj-value ≤ 0.05) are highlighted in red (non-histone proteins) and blue (histones). Selected sites and gene names of corresponding proteins are annotated.

