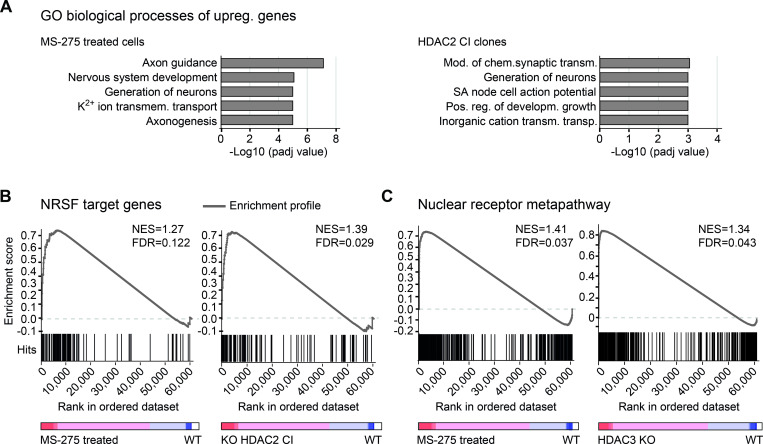
Fig 5. Transcriptional control by HDAC1/2/3 catalytic activity.
(A) Enriched gene ontology terms of significantly upregulated genes upon MS-275 treatment (left panel) or HDAC2 inactivation (right panel) (≥ 2-fold change over wildtype cells, padj-value ≤ 0.05), determined with the Enrichr tool. Only genes elevated in both HDAC2 CI clones (wildtype and knockout background) were considered for analysis. (B) Gene set enrichment analysis (GSEA) showing the correlation of NRSF target genes with transcription profiles of MS-275 treated cells (left) and KO HDAC2 CI cells (right). (C) GSEA of genes associated with the nuclear receptor metapathway of transcriptome data of MS-275 treated cells (left) and HDAC3 KO cells (right). (B-C) Running enrichment score (grey line), reflecting to which degree NRSF or nuclear receptor metapathway regulated genes from defined, publicly available lists are overrepresented at the extremes of ranked gene expression data from the indicated cell lines. The gene tags (“Hits”, black lines) indicate the location of the genes from the defined lists within the ranked datasets. The colored bar shows positive (red) and negative (blue) correlations with indicated cell lines. NES (normalized enrichment score) and FDR q-value are indicated for each analysis.

