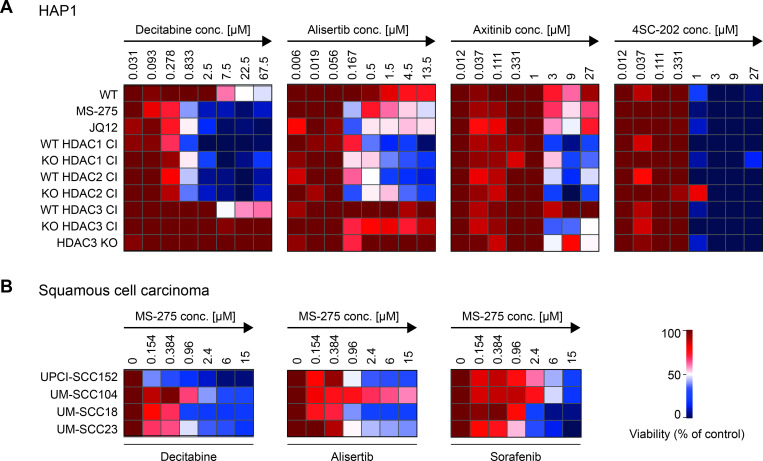
Fig 6. HDAC inactivation sensitizes cells to clinically approved anti-tumor drugs.
(A) The heatmaps illustrate the sensitivity of different HAP1 HDAC1/2/3 CI cell lines or HDACi treated cells to anti-tumor drugs. JQ12 or MS-275 treated cells, HDAC1/2/3 CI expressing cells (in wildtype and knockout background) and HDAC3 KO cells were incubated with increasing concentrations of following drugs: decitabine, alisertib, axitinib and 4SC-202 (negative control), indicated from left to right panel. The screen was performed in duplicate. Mean values, normalized to plate internal positive and negative controls, are shown as relative viability (in %) over the controls. (B) Combinatorial effects of MS-275 and anti-tumor drugs determined for squamous cell carcinoma cell lines. Following cell lines were included: UPCI-SCC152, UM-SCC104, UM-SCC18 and UM-SCC23. The IC50 for the respective tumor drug was determined for each cell line. The heatmaps show how relative IC50 values change upon simultaneous treatment with MS-275 (concentrations are indicated). The color bar represents the relative viability of duplicate screens (in %) over the control. The control was treated with the indicated tumor drug, but not with MS-275 (set as 100%).

