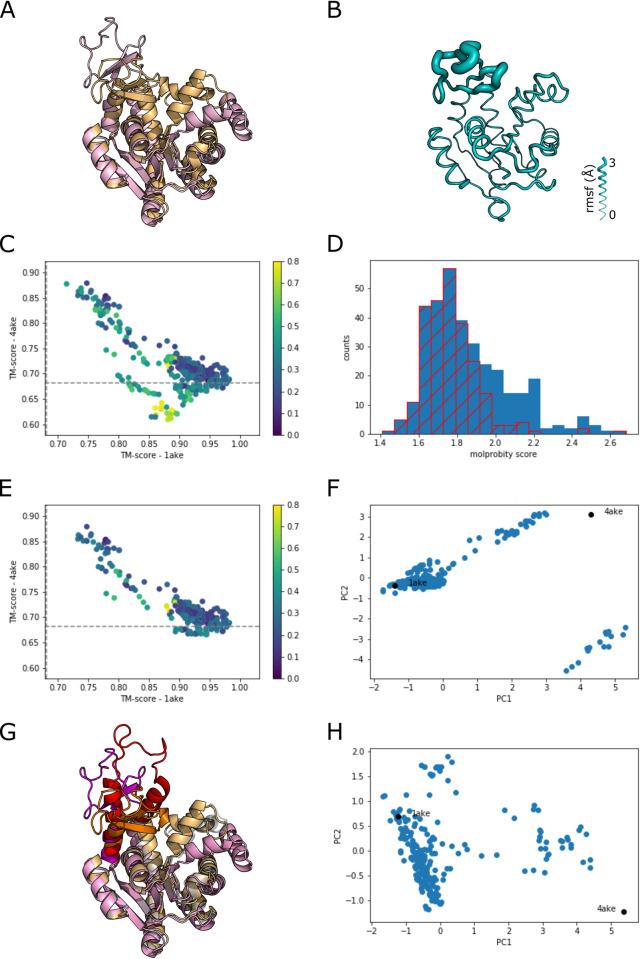
Fig 2. Sampling conformational flexibility of Adenylate Kinase (AK).
A) Crystal structures of Adenylate Kinase aligned on residues 1–25: closed, 1ake (lightorange) and open, 4ake (lightpink). B) AK model with the thickness of the chain based on the rmsf for the 15 AF2 models from the unmodified MSA. C) TM score plot comparing all AF2 models to the two crystal structures. The dashed line is the TM score between the two experimental structures. The color scale is based on the relative molprobity score, (MP–MPmin) / MPmin. D) Histogram of molprobity scores. In blue are all of the models. The hatched red plot is for the models parsed by excluding sets that are one standard deviation above the median of all models. E) TM score plot of the parsed set of models. F) PCA plot of the first two components for the parsed set of models. Note the outlier set to the lower right. G) Highlighted is the ATP binding region, 1ake (orange), 4ake (magenta), and a representative structure from the outliers in ‘F’ (red). H) PCA plot removing the misfolded models shown in ‘G’.

