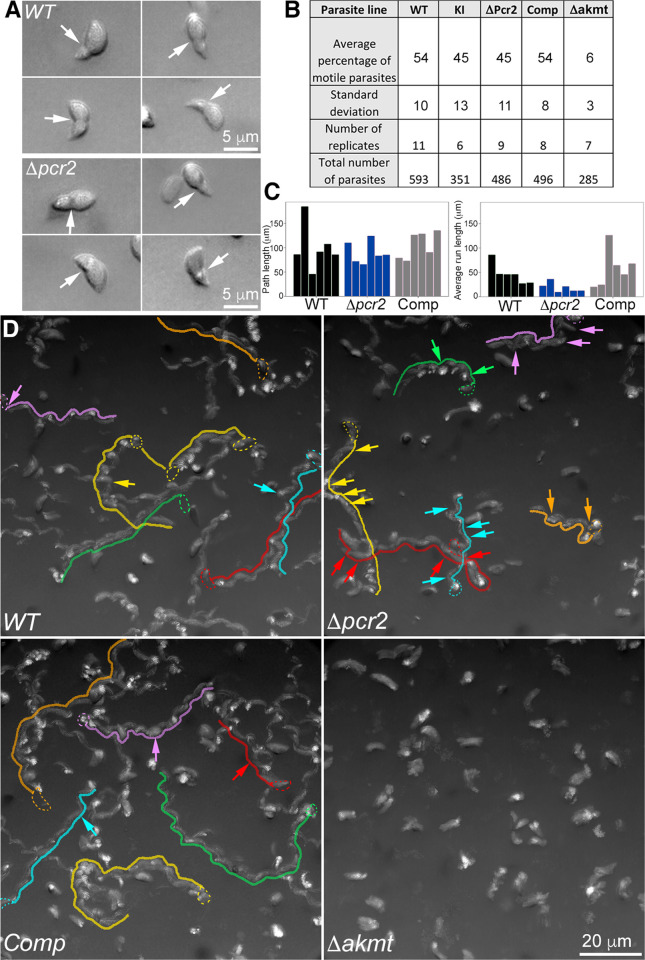
Fig 7. The Δpcr2 parasite moves spasmodically in Matrigel.
A. Four examples each of wild-type and Δpcr2 parasites that displayed constriction during movement in 50% Matrigel. B. Table showing percentage of motile RHΔhxΔku80 (WT), mE-Pcr2 Knock-in (KI), Δpcr2, complemented (Comp), and Δakmt parasites in the 3-D motility assay. C. Bar graphs that show the path length and average run length of the trajectories highlighted in D. Average run length is calculated by dividing the path length by the number of runs within each trajectory. The number of runs is defined as 1+ number of sustained (> ~11 sec) pauses. D. Movement tracks for WT, Δpcr2, complemented (Comp), and Δakmt parasites generated by projections of 3-D motility timelapses. See S6 and S7 Videos. To make these 2-D images of parasites’ paths through the 3-D gel, a projection of the 3-D stack at each time point was first generated by Stack focuser (ImageJ/Fiji), then 150 consecutive timeframes in the projected sequence were compressed into a single frame. Six traces each for WT, Δpcr2, and complemented parasites are highlighted by traces drawn by hand. Some of the pauses in the parasite movement that lasted for 7 frames (~ 11 sec) or longer in these traces are indicated with arrows of the same color.

