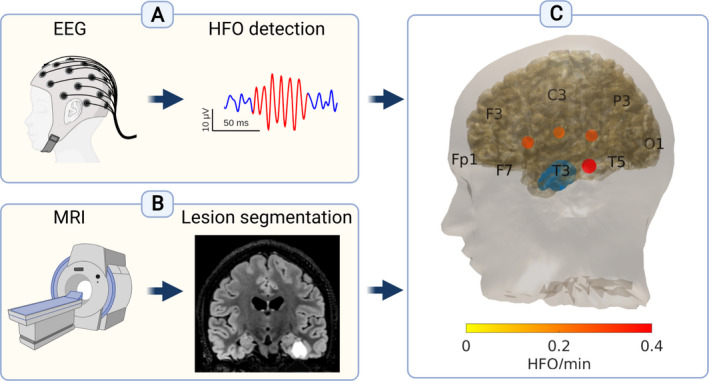
FIGURE 1.

Scalp high frequency oscillations (HFO) detection from the EEG and lesion volume estimation from the MRI of each patient. Our analysis pipeline is demonstrated in the exemplary case of patient 11 with focal lesional epilepsy associated with a ganglioglioma in the left inferior/basal temporal region. (A) We analyzed scalp EEG with high sampling frequency (>1000 Hz) and detected HFO. (B) We analyzed MRI scans, delineated the epileptogenic lesion, and calculated the lesion volume. (C) 3D reconstruction of the cortical surface generated from the MRI. The lesion is depicted in blue. Blobs in different shades of red depict the scalp HFO rate in HFO area channels. Different color intensity corresponds to different HFO rates. Created with BioRender.com
