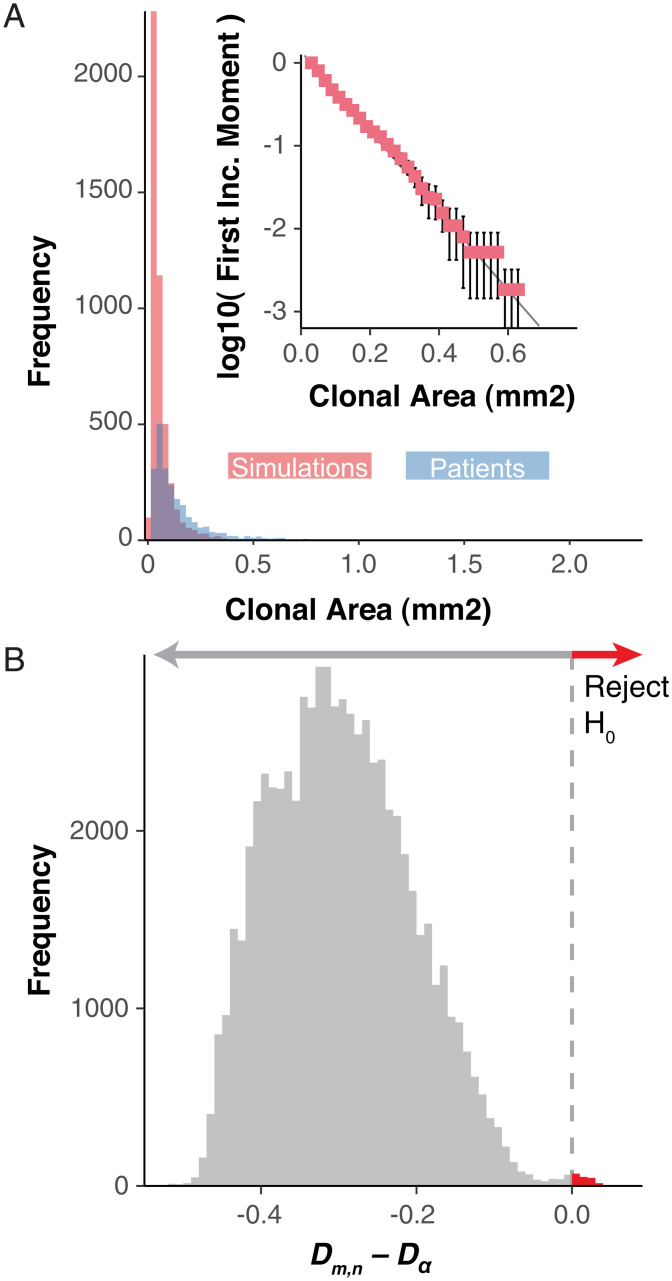
Fig. 2.
Homeostasis imposes log-linear clonal distributions. Neutral model dynamics from 3D simulations of various sizes where A is the cumulative clonal area frequencies of all patient biopsies (blue) and randomly chosen simulations for each of the patient-specific biopsies such that the number of simulations chosen is equal across the three simulated sizes and the sum of the number of biopsies equals that of the total biopsies for the patient (red). (Inset) The log-10 transformed first incomplete moment for the same random sampling of patient comparable simulations for PD20399 (error bars denote SD for 100 repeated samplings). (B) The difference from the Komlogrov–Smirnov test statistic (Dm,n) and critical value (Dα) for all patient biopsies to patient-specific model simulation’s first incomplete moment distributions for all simulation sizes. The red arrow denotes comparisons where the null hypothesis can be rejected.

