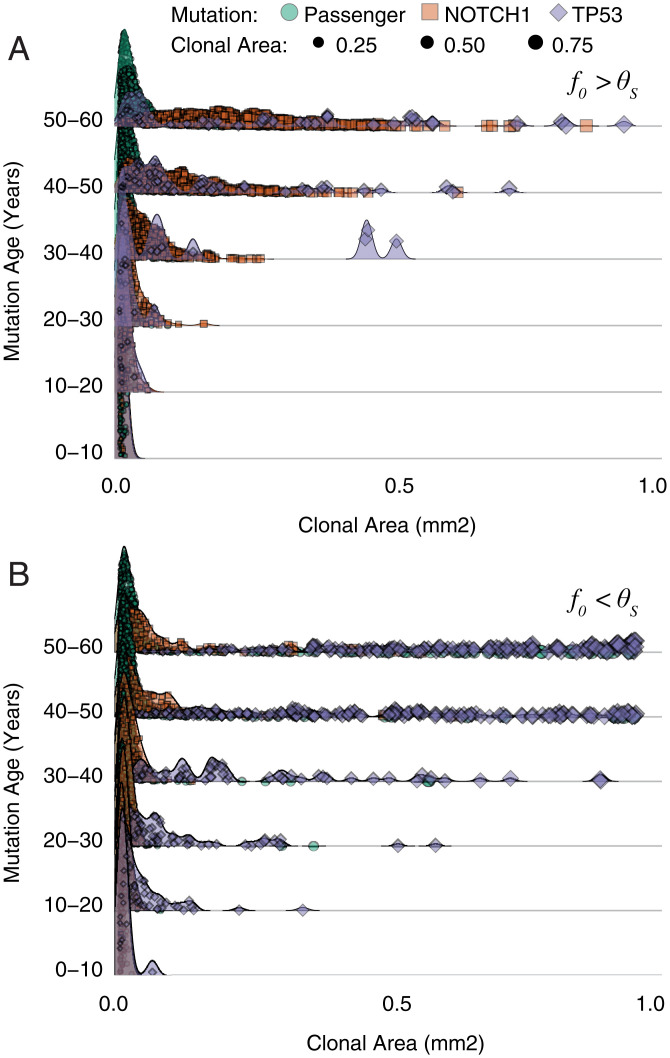
Fig. 5.
Combined effects adhere to age-dependent expansions. All 58-y 1-mm2 paired parameter simulations from Fig. 3 are displayed where TP53 persistence () is greater than NOTCH1 persistence () (A) and > (B) (for = see SI Appendix). Individual clones are broken into three groups (passenger, NOTCH1, and TP53) with corresponding sizes of each clone.

