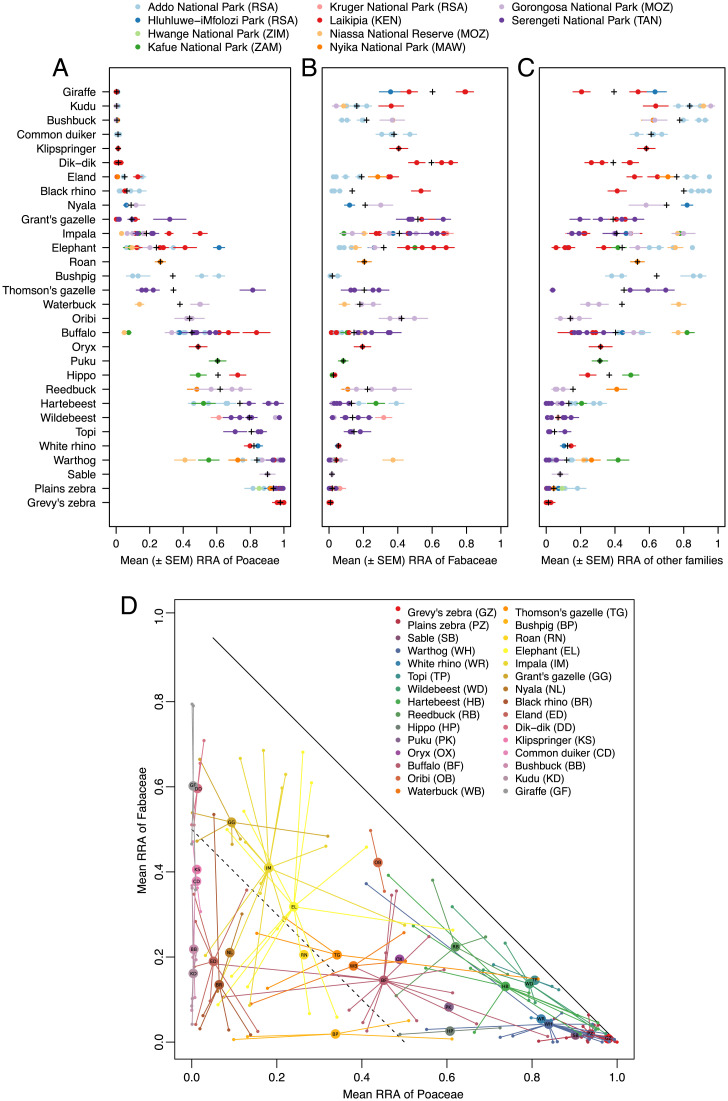
Fig. 2.
Proportional representation of plant families in African savanna large-herbivore diets. Mean (±1 SE) RRA of (A) grasses (Poaceae), (B) legumes (Fabaceae), and (C) all other plant families in the diet of each herbivore population in each sampling bout (n ≥ 10 fecal samples per point). Colors denote site. For populations sampled repeatedly at the same site, we show data from each bout (season/year) separately. Black crosses (+) are species-level means across all sites and bouts. (D) Mean RRA of grasses (x axis) and legumes (y axis) for each species (indicated by colors and two-letter identifiers within the central points). Small points are values for each site and bout; large points are species-level averages across all sites and bouts. Solid diagonal line corresponds to 100% of diet; dashed line corresponds to 50% of diet.

