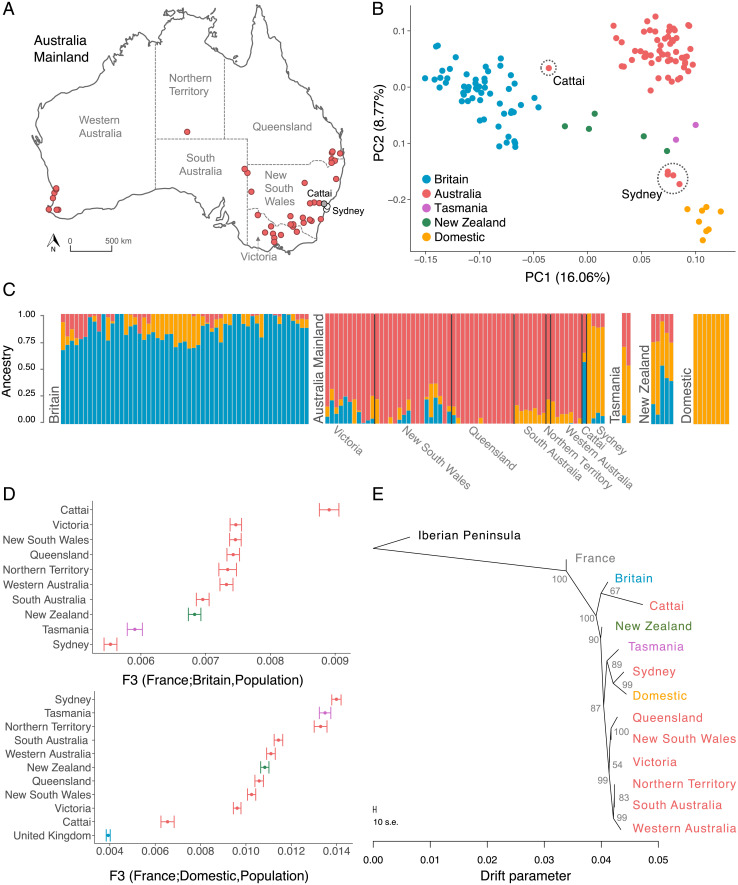
Fig. 3.
Genetic structure and ancestry of rabbit populations. (A) Map of mainland Australia with location of samples. Gray circles correspond to Cattai, white circles to Sydney. (B) Principal component analysis of rabbits from wild and domestic rabbits. Dashed circles highlight individuals from Cattai and Sydney. (C) Ancestry fractions estimated with Admixture assuming three ancestral populations (K = 3). Each bar represents one individual and is colored according to the ancestry proportions. (D) f3 statistics of rabbit populations reflecting the shared genetic drift between mainland Australian populations, New Zealand, Tasmania, and rabbits from Britain (Top) or domestic rabbits (Bottom). Bars correspond to the SE. (E) Historical relationships among populations reconstructed with allele frequency data using the TreeMix program. The branch lengths reflect the amount of genetic drift, and the scale bar shows 10 times the mean SE of the entries in the sample covariance matrix. The numbers are percent bootstrap support calculated by resampling blocks of SNPs 1,000 times.

