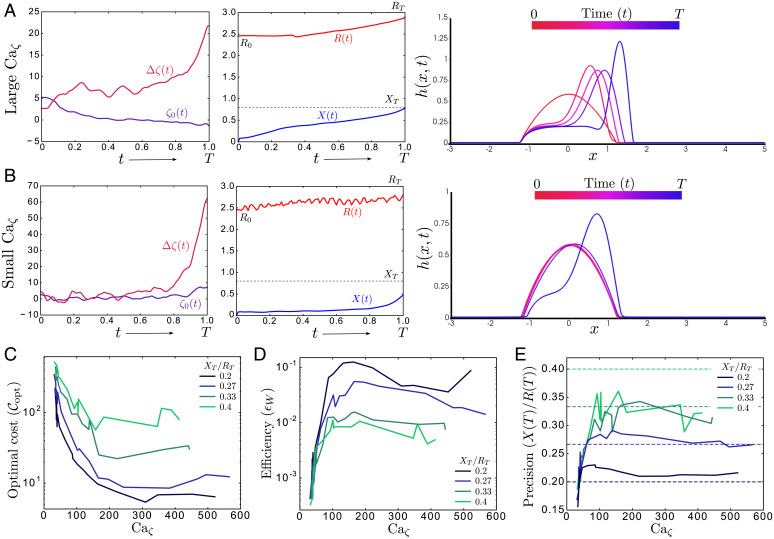
Fig. 4.
PDE optimal control. (A) The optimal activity controls (; Left) and corresponding trajectories for the state variables (; Center) and the full drop profile (h(x, t); Right), obtained by numerical optimization for small surface tension or large active capillary number (, Ca). The drop adopts a strongly asymmetric shape, with an advancing peak and receding tail, like in ref. 25. (B) Similar plots with the optimal activity controls (; Left), and corresponding drop trajectory (, Center; h(x, t), Right), now obtained for large surface tension or small active capillary number (γ = 2, Ca). The transport plan fares poorly as the drops fails to reach the desired final position and size and wastes a significant amount of energy in futile size oscillations (R(t); Center) that don’t aid in transport. Both A and B are computed by using and RT = 3 ( and is kept fixed throughout), though similar policies are obtained for other values of as well. (C–E) The total cost (; C), efficiency (ϵW [Eqs. 13 and 14]; D), and precision (; E) of the numerically computed optimal transport protocol plotted against Ca, for different tasks labeled by increasing (blue to green). Remarkably, the performance curves present an optimal trade-off in balancing active forces against passive ones to attain improved drop transport plans at intermediate values of Ca.

