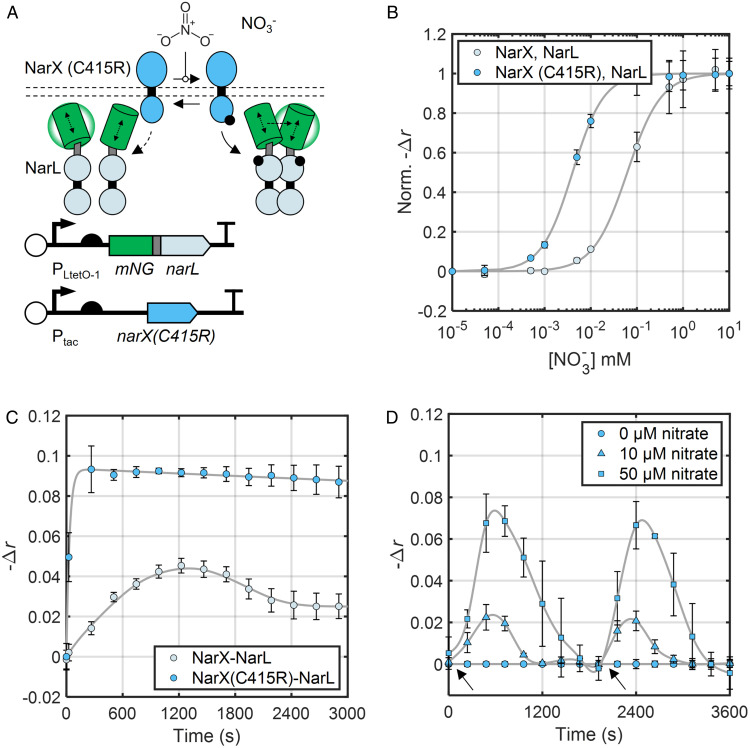
Fig. 4.
A NarX phosphatase mutant enhances NarL dimerization and reveals nitrate consumption dynamics. (A) Schematic of plasmids for inducible expression of NarX mutant with weakened phosphatase activity (NarX(C415R)) and mNG-NarL. (B) Nitrate dose–response curves of mNG-labeled NarXL systems expressing NarX WT and NarX(C415R) 15 min after nitrate addition. Data points and error bars represent the mean and SD of three biological replicates measured simultaneously normalized to the average values for minimum and maximum nitrate added. Initial data point corresponds to 0 mM nitrate. Fit lines are based on the Hill function (Eq. 3), and fit parameters are available in SI Appendix, Table S4. NarX and mNG-NarL were induced with 32 µM IPTG and 5.0 ng/mL aTc, respectively. (C) Kinetics of mNG-NarL phosphorylation by WT NarX and NarX (C415R). NarX and mNG-NarL were induced with 32 µM IPTG and 6.0 ng/mL aTc, respectively. Data points and error bars represent the mean and SD of three biological replicates collected on three separate days. Fit lines are smoothing splines to guide the eye and estimate peak signal magnitude for τ1/2 calculation (Materials and Methods). (D) NarXL activity under changing extracellular nitrate. Black arrows indicate nitrate addition to the culture. Data are a subset of a longer experiment where the cultures had already been treated with and cleared their respective added nitrate (as in SI Appendix, Fig. S12). Time 0 corresponds to 72 min after initial nitrate addition. Data points and error bars represent the mean and SD of three biological replicates measured simultaneously. Fit lines are smoothing splines to guide the eye (Materials and Methods). NarX and mNG-NarL were induced with 32 µM IPTG and 5.0 ng/mL aTc, respectively.

