Fig. 2.
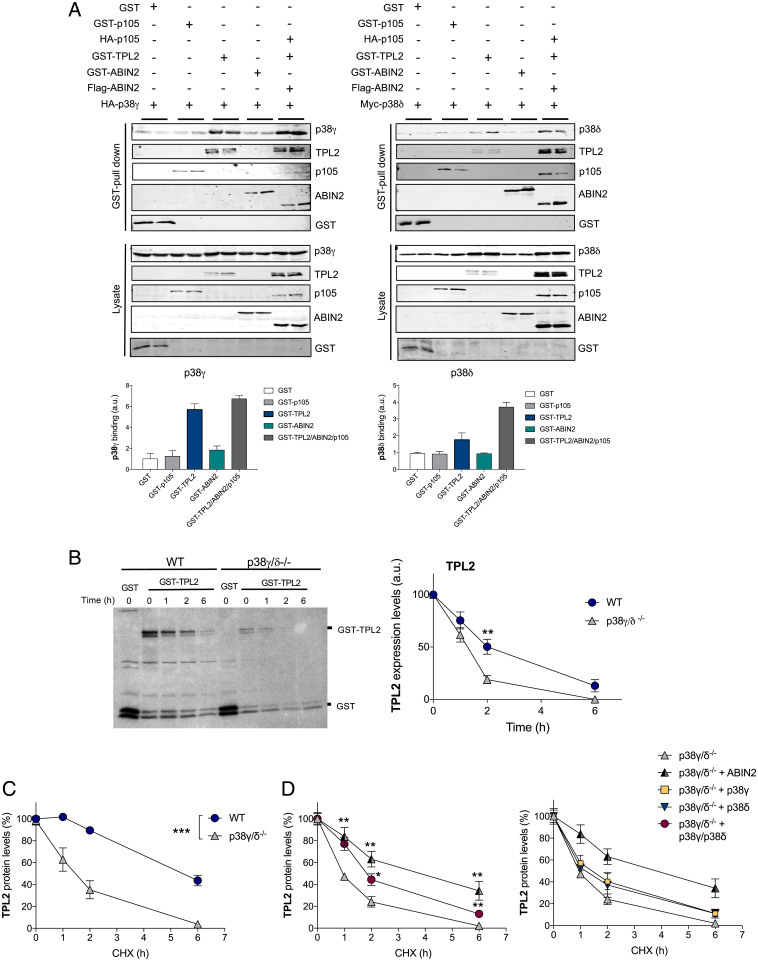
p38γ and p38δ regulate TPL2 protein levels by modulating its stability. (A) HEK293 cells were transfected with plasmids encoding the indicated proteins. After transfection, cells were lysed, pull downs of GST proteins were performed, and pellets were immunoblotted with the indicated antibodies. Total lysates were immunoblotted with the indicated antibodies to examine protein expression. (A, Lower) p38γ and p38δ band intensities in pellets were quantified using the Fiji program. Histogram values are means ± SEM of two independent experiments in duplicate. (B) Metabolic labeling and pulse-chase analysis. WT or p38γ/δ−/− MEFs transfected with plasmids encoding GST-TPL2 or GST alone as a control were pulse labeled with 35S-Met/Cys and lysed. (B, Left) Pull downs of GST proteins were performed after the times of chase indicated. TPL2 was separated by SDS-PAGE and revealed by autoradiography. (B, Right) TPL2 bands were quantified using the Fiji program, and data show mean ± SEM from two experiments in duplicate. **P ≤ 0.01 relative to WT. (C) CHX-chase analysis. WT or p38γ/δ−/− MEFs were transfected with a plasmid encoding GST-TPL2 and incubated with 100 μg/mL CHX for the indicated times before lysis. Following cell lysis and SDS-PAGE, immunoblotting was carried out with antitotal TPL2 (SI Appendix, Fig. S2). TPL2 bands were quantified using the Odyssey infrared imaging system, and data show mean ± SEM from two experiments in duplicate. ***P ≤ 0.001 relative to WT. (D) p38γ/δ−/− MEFs were transfected with plasmids encoding GST-TPL2 alone or with Flag-ABIN2, hemagglutinin (HA)-p38γ, myc-p38δ, or HA-p38γ plus myc-p38δ and treated with CHX as in C. Following cell lysis, SDS-PAGE, and immunoblotting with antitotal TPL2 (SI Appendix, Fig. S2), TPL2 bands were quantified. Data show mean ± SEM from two experiments in duplicate. *P ≤ 0.05 relative to p38γ/δ−/− MEFs transfected with GST-TPL2 alone; **P ≤ 0.01 relative to p38γ/δ−/− MEFs transfected with GST-TPL2 alone.

