Fig. 3.
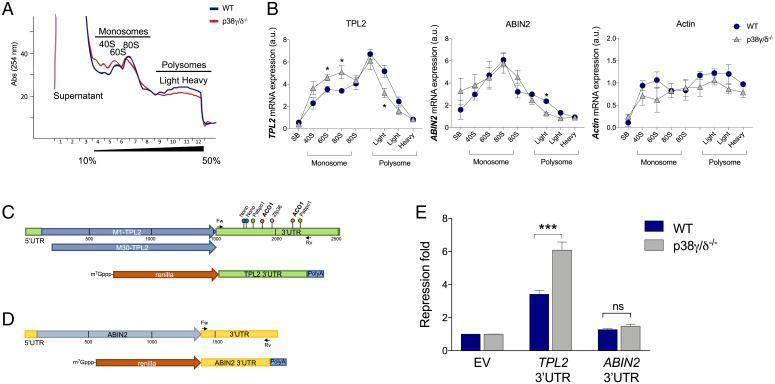
p38γ and p38δ regulate TPL2 translation. (A) Polysome profiling (10 to 50% sucrose gradient) of total WT (dark blue) and p38γ/δ−/− (red) MEF lysates. The figure shows one representative profile (n = 3). (B) qPCR of TPL2, ABIN2, and β-actin mRNA from polysome profile fractions. Results were normalized to GAPDH mRNA expression. Data show mean ± SEM from one representative experiment in triplicate. *P ≤ 0.05 relative to WT MEFs. (C, Upper and D, Upper) Schematic representations of mouse TPL2 mRNA (C) and ABIN2 mRNA (D). TPL2 is expressed as two isoforms due to the alternative translational initiation at methionine 1 (M1) or methionine 30 (M30) (27). Representations show 5′UTR, coding regions (M1-Tpl2, M30-Tpl2, and ABIN2), and 3′UTR. Cloning sites for psiCHECK2 plasmids are shown on the 3′UTRs, with forward (Fw) and reverse (Rv) primers indicated. Some binding sites for the RBPs (ACO1, NonO, PABPC1, and ZFP36) at the TPL2 3′UTR are indicated (C, Upper). (C, Lower) Schematic representation of the psiCHECK2-Renilla-TPL2 3′UTR (TPL2 3′UTR) and psiCHECK2-Renilla-ABIN2 3′UTR (ABIN2 3′UTR). (E) WT and p38γ/δ−/− MEFs were transfected with luciferase plasmids psiCHEK2 as empty vector (EV) or containing TPL2 3′UTR or ABIN2 3′UTR. Renilla values were normalized against Firefly levels, and repression fold was calculated for the TPL2 3′UTR or the ABIN2 3′UTR reporter relative to EV for each condition. Data are mean ± SEM from one representative experiment in triplicate. ns, not significant. ***P ≤ 0.001 relative to WT.

