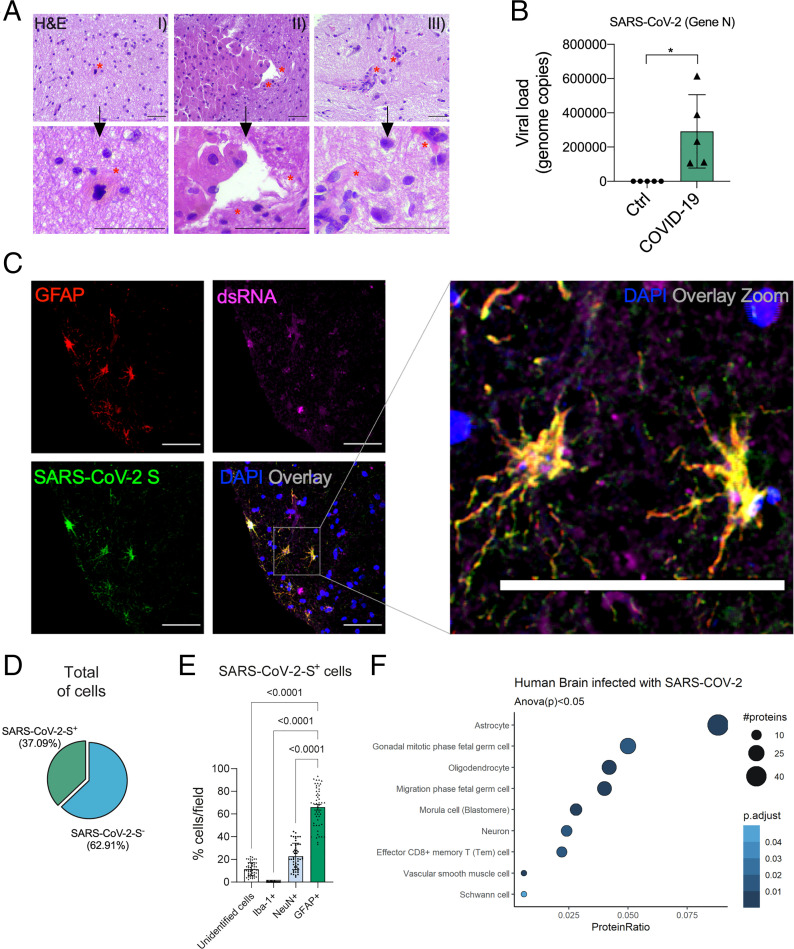
Fig. 2.
SARS-CoV-2 infects the CNS, replicates in astrocytes, and causes brain damage. (A) Histopathological H&E images of postmortem brain tissue from individuals who died of COVID-19. Five of 26 individuals showed signs of brain damage as represented in the images by (A, I) areas of necrosis, cytopathic damage (i.e., enlarged, hyperchromatic, atypical-appearing nuclei), (A, II) vessels with margination of leukocytes and thrombi, and (A, III) an infiltration of immune cells. The alterations are indicated by red asterisks and respective zoomed-in images (Lower). Images were acquired with 400× magnification. (Scale bars: 50 µm.) (B) Viral load in brain tissues from the five COVID-19 patients who manifested histopathological alterations in the brain as compared with samples from SARS-CoV-2–negative controls (n = 5 per group). *P < 0.05 compared with the control group. (C) Representative confocal images of the brain tissue of one COVID-19 patient who manifested histopathological alterations. Immunofluorescence targeting GFAP (red), dsRNA (magenta), SARS-CoV-2-S (green), and nuclei (DAPI; blue). Images were acquired with 630× magnification. (Scale bars: 50 µm.) (D) Percentage of SARS-CoV-2-S–positive cells in the tissue of the five COVID-19 patients. (E) Percentage of GFAP+ vs. unidentified cells, Iba1+, and NeuN+ among all infected cells. Ten fields/cases were analyzed. (F) Cell type enrichment analysis using the dataset generated from postmortem brain tissue from patients who died of COVID-19. Dot size represents the number of proteins related to the respective cell type, and the color represents the P value adjusted by false discovery rate. All data are shown as mean ± SEM. P values were determined by two-tailed unpaired tests with Welch's correction (B) or ANOVA one way followed by Tukey’s post hoc test (E). H&E: hematoxylin and eosin; DAPI: 4′,6-diamidino-2-phenylindole.

