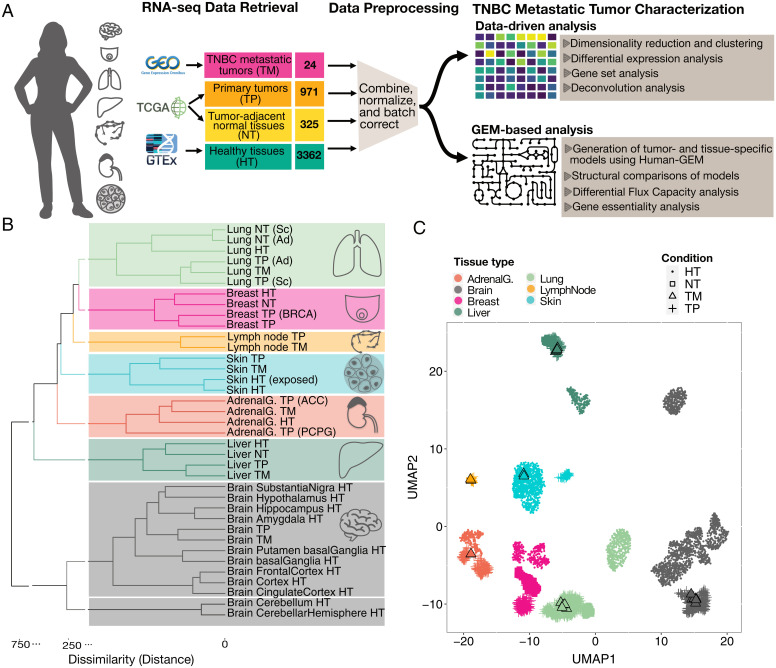
Fig. 1.
Comparison of basal TNBC metastatic and primary tumors, healthy tissues, NTs, and other TPs. (A) Study design. From GSE110590, we extracted only samples for basal-TNBC subtype including TPs (breast-TPs) and metastases in brain, lung, liver, lymph node, adrenal gland, and skin (TNBC-TMs) and matched them with the TPs of their metastatic organs and their associated NT adjacent to the tumor from TCGA and healthy tissues from GTEx. We performed identical processing of all samples to obtain TPM values. We then utilized several techniques to characterize the differences between TNBC-TMs, breast-TPs, and the TPs of the metastatic sites across tissue types. (B) General overview of integrated datasets using HHK clustering on median TPM values of each gene among all samples for each condition. The dendrogram is colored based on the optimal number of clusters as determined from the silhouette plot. BRCA represents breast invasive carcinoma; ACC, adrenocortical carcinoma; Ad, adenocarcinoma; Adrenal G., adrenal gland; PCPG, pheochromocytoma and paraganglioma; Sc, squamous cell carcinoma. (C) UMAP plot of all samples in the combined dataset. Points are colored by the associated tissue, and the shape of each point represents the condition: healthy tissue (HT), TM, TP, or NT.

