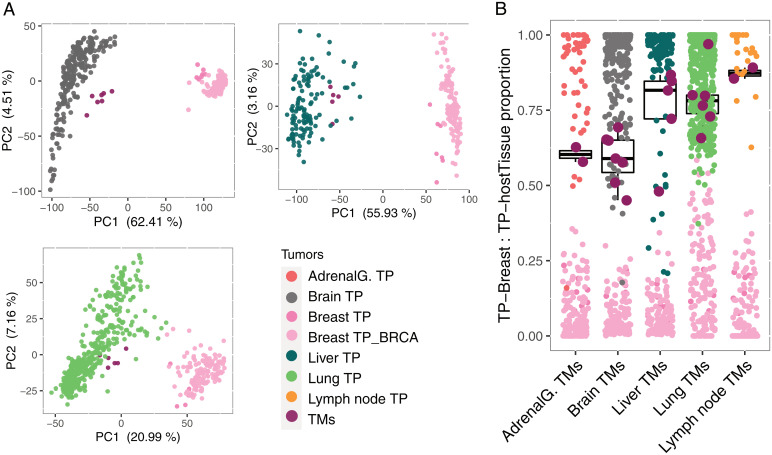
Fig. 2.
Intermediate state of TNBC-TMs between breast-TPs and TPs of the metastatic organs. (A) PCA plot for breast-TP and the associated TM in distinct tissue types. In all three groups, TM samples (maroon) lie between breast-TP samples (pink) and the TP samples of their metastatic organs and are closer to TPs of their metastatic organs. (B) Deconvolution analysis of the TNBC-TM samples using median expression levels of breast-TPs and TPs of the metastatic destination tissues as references. The result of the analysis is the fraction of similarity of each TM sample (maroon) to the TPs of the destination tissue. A value of 1 on the y axis indicates the maximum proportion of “destination tissue_TP contribution”, meaning maximum similarity to median expression levels of “destination tissue_TP” as reference, and 0 indicates the minimum proportion of “destination tissue_TP contribution.” Boxplot represents the distribution of the proportion of “destination tissue_TP contribution” for TMs. The points, breast-TPs (pink), and TPs of the tissue of destination (colored by cancer type) deconvolution fractions are shown as references. AdrenalG., adrenal gland; BRCA represents breast invasive carcinoma.

