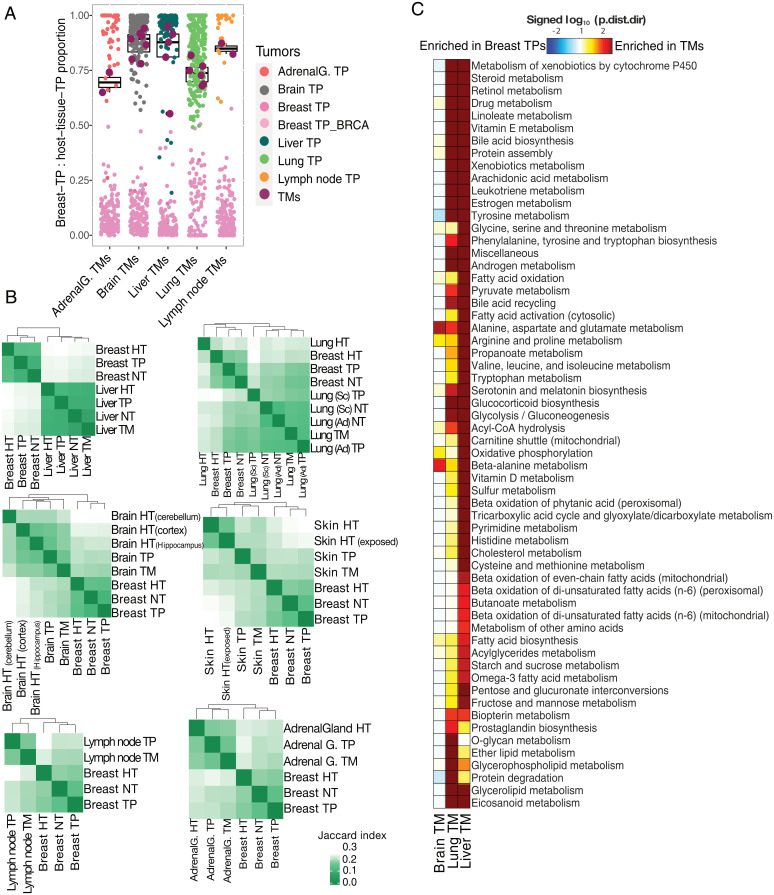
Fig. 4.
Divergence of TNBC-TMs from breast-TPs based on metabolic signatures. (A) Deconvolution analysis of the TNBC-TM samples using median expression levels of metabolism-associated genes in breast-TPs and TPs of the tissue of destination as references. The result of the analysis is the fraction of similarity of each TM sample (maroon) to the TPs of the tissue of its destination based on only their metabolic genes. Boxplot represents the distribution of the proportion of “destination tissue_TP contribution” for TMs. (B) Heatmaps showing comparison of reaction content of GEMs specific to TNBC-TMs in distinct tissues with breast-TPs as their tumor of origin and GEMs specific to TPs of the tissue of destination and their matched healthy tissue (HT) and NTs, based on the Jaccard index. (C) Subsystem directional GSA results for the comparisons of breast-TPs in distinct tissues with breast-TPs. Shown are the log10-transformed “distinct directional” P values (p.dist.dir) for subsystems with P value < 0.01 in at least one comparison. The log10-transformed P values are signed, meaning that gene sets significantly enriched in expression increases are positive, while those enriched more in expression decreases are negative. Ad, adenocarcinoma; AdrenalG., adrenal gland; BRCA represents breast invasive carcinoma; Sc, squamous cell carcinoma.

