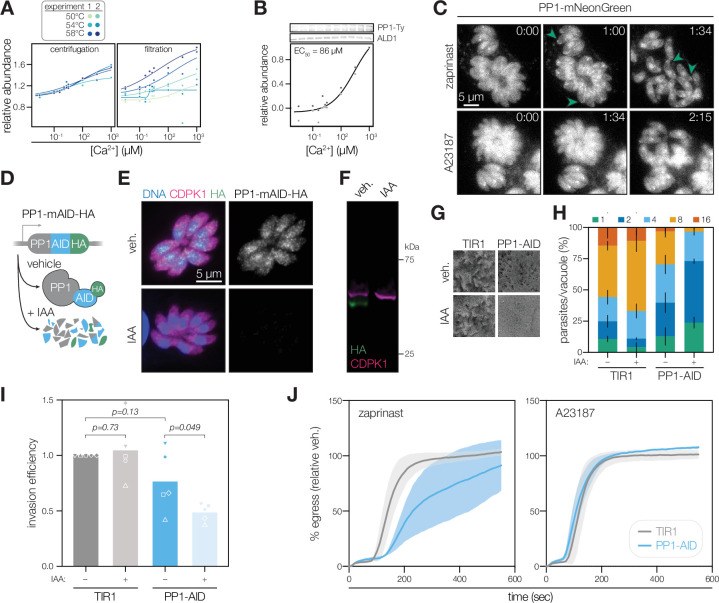
Figure 5. PP1 is a Ca2+-responsive enzyme involved in T. gondii egress and invasion.
(A) The Ca2+-dependent stabilization of PP1 (TGGT1_310700) in each mass spectrometry experiment. (B) Immunoblotting for endogenously tagged PP1-mNG-Ty at different Ca2+ concentrations and thermal challenge at 58 °C. Abundance is calculated relative to the band intensity at 0 µM Ca2+ and scaled. Points in shades of gray represent different replicates. A dose-response curve was calculated for the mean abundances. (C) Parasites expressing endogenously tagged PP1-mNG egress after treatment with 500 µM zaprinast or 4 µM A23187. Arrows show examples of PP1 enrichment at the apical end. Time after treatment is indicated in m:ss. (D) Rapid regulation of PP1 by endogenous tagging with mAID-HA. IAA, Indole-3-acetic acid (IAA). (E) PP1-mAID-HA visualized in fixed intracellular parasites by immunofluorescence after 3 hr of 500 µM IAA or vehicle treatment. Hoechst and anti-CDPK1 are used as counterstains (Waldman et al., 2020). (F) PP1-mAID-HA depletion, as described in (E), monitored by immunoblotting. The expected molecular weights of PP1-mAID-HA and CDPK1 are 48 and 65 kDa, respectively. (G) Plaque assays of 1,000 TIR1 and PP1-mAID-HA parasites infected onto a host cell monolayer and allowed to undergo repeated cycles of invasion, replication, and lysis for 7 days in media with or without IAA. (H) The number of parasites per vacuole measured for PP1-mAID-HA and the TIR1 parental strain after 24 hr of 500 µM IAA treatment. Mean counts (n=3) are expressed as a percentage of all vacuoles counted. (I) Invasion assays PP1-mAID-HA or TIR1 parental strains treated with IAA or vehicle for 3 hr. Parasites were incubated on host cells for 60 min prior to differential staining of intracellular and extracellular parasites. Parasite numbers were normalized to host cell nuclei for each field. Means graphed for n=5 biological replicates (different shapes), Welch’s t-test. (J) Parasite egress stimulated with 500 µM zaprinast or 8 µM A23187 following 3 h of treatment with vehicle or IAA. Egress was monitored by the number of host cell nuclei stained with DAPI over time and was normalized to egress in the vehicle-treated strain. Mean ±S.D. graphed for n=3 biological replicates.

