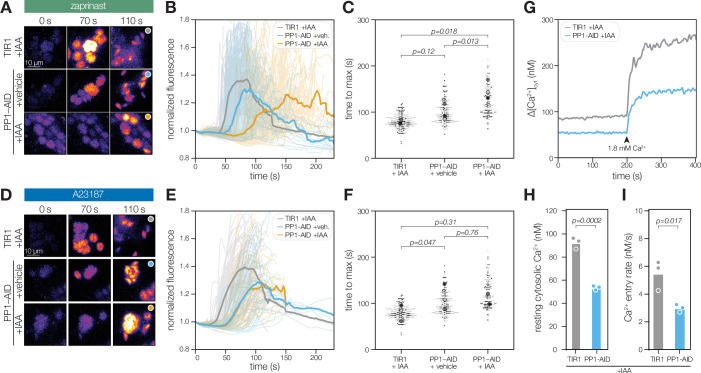
Figure 7. PP1 ensures rapid Ca2+ mobilization prior to zaprinast-induced egress.
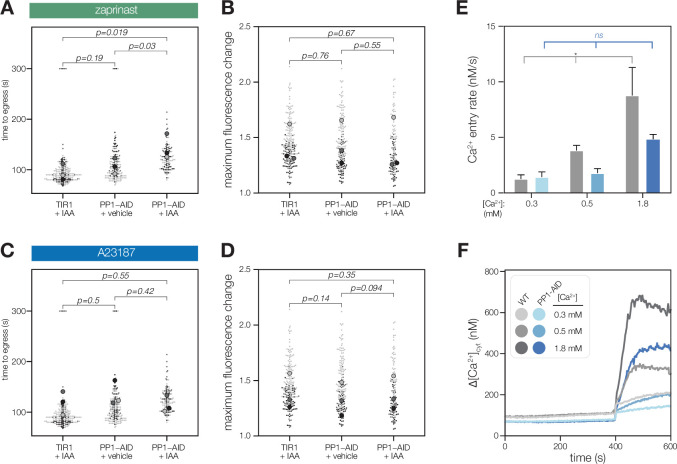
(A) Selected frames of time-lapse images of PP1-AID parasites expressing the genetically encoded Ca2+ indicator GCaMP following treatment with 500 µM zaprinast. (B) Normalized GCaMP fluorescence of individual vacuoles was tracked after zaprinast treatment and prior to egress (opaque lines). The solid line represents the mean normalized fluorescence of all vacuoles across n=3 biological replicates. (C) The time to maximum normalized fluorescence of individual vacuoles after zaprinast treatment. Different replicates are shown in different shades of gray. Small points correspond to individual vacuoles; large points are the mean for each replicate. p Values were calculated from a two-tailed t-test. (D) Selected frames of time-lapse images of PP1-AID parasites expressing the genetically encoded Ca2+ indicator GCaMP following treatment with 4 µM A23187. (E) Normalized GCaMP fluorescence of individual vacuoles was tracked after A23187 treatment and prior to egress (opaque lines). The solid line represents the mean normalized fluorescence of all vacuoles across n=3 biological replicates. (F) The time to maximum normalized fluorescence of individual vacuoles after A23187 treatment. Small points correspond to individual vacuoles; large points are the mean for each replicate. p Values were calculated from a two-tailed t-test. (G) Fluorescence intensity of Fura2/AM-loaded TIR1 or PP1-AID parasites treated with IAA for 5 hr before and after addition of the 1.8 mM Ca2+. Representative traces from three biological replicates. (H) Resting cytoplasmic [Ca2+] prior to incubation in buffers with elevated [Ca2+]. p Values were calculated from an ANOVA. (I) The rate of Ca2+ entry in the first 20 s after addition of 1.8 mM Ca2+ to parasites p values were calculated from an ANOVA. Entry rates following addition of other concentrations are shown in Figure 7—figure supplement 1.


