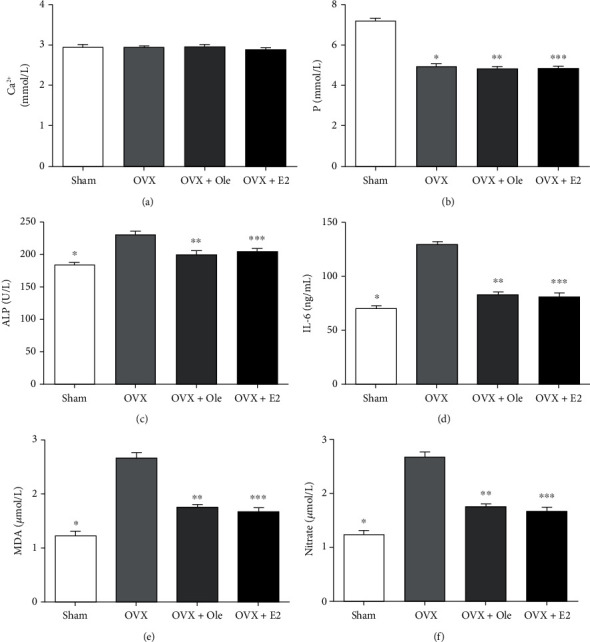
Figure 2.

Serum metabolite indexes of different groups at 12 weeks postoperation: (a) comparison of Ca2+ level; (b) comparison of P level; (c) comparison of ALP level; (d) comparison of IL-6 level; (e) comparison of MDA level; (f) comparison of nitrate level. Data express the means ± SD (n = 20) (∗P < 0.05, ∗∗P < 0.05, ∗∗∗P < 0.05 vs. OVX group).
