Figure 3.

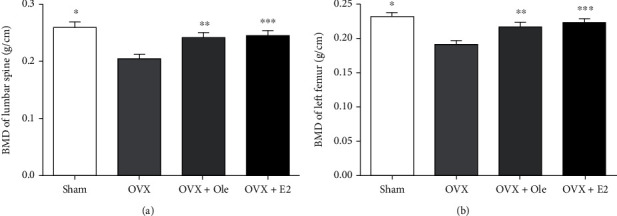
Change of BMD in experimental SD rats after three months. (a) Bone density of the lumbar spine. (b) Bone density of left femur. Data represent the means ± standard deviation (SD) (n = 20) (∗P < 0.05, ∗∗P < 0.05, ∗∗∗P < 0.5 vs. OVX group).

Change of BMD in experimental SD rats after three months. (a) Bone density of the lumbar spine. (b) Bone density of left femur. Data represent the means ± standard deviation (SD) (n = 20) (∗P < 0.05, ∗∗P < 0.05, ∗∗∗P < 0.5 vs. OVX group).