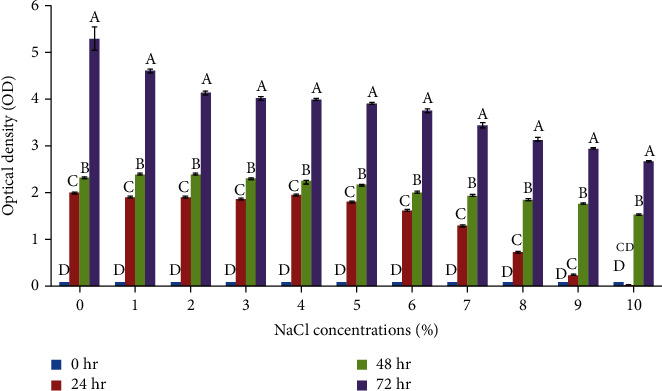
Figure 4.

Impact of various salt (NaCl) concentrations on the growth of LBG-1-13 over different incubation times. Data are averages ± SD values (n = 3). Means having the different letters within each concentration differ significantly at (p ≤ 0.05) by Tukey (HSD).
