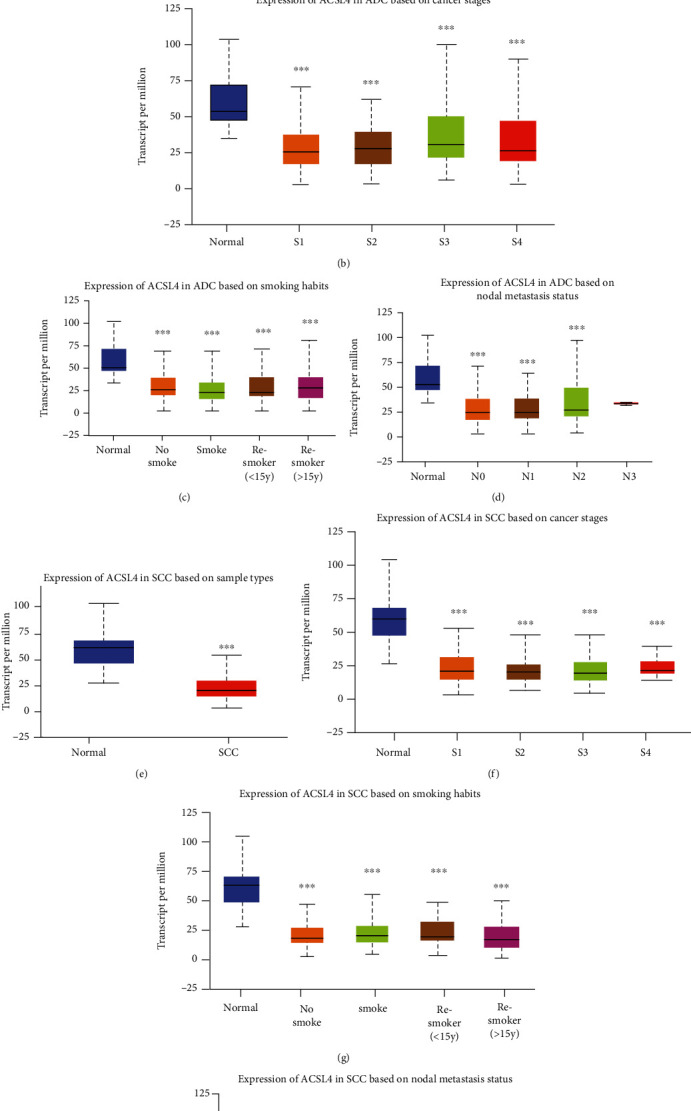
Figure 3.

Levels of ACSL4 mRNA expression in patients suffering from NSCLC that were included in the TCGA dataset cohorts. (a, e) A comparison of the ACSL4 expression in ADC and SCC tissues with that of normal controls is depicted in the plot chart. (b–d) Plots chart illustrating the expression of ACSL4 mRNA between cancer stages, smoking habits, and nodal metastasis status in ADC patients. (f–h) Plots chart illustrating the expression of ACSL4 mRNA between cancer stages, smoking habits, and nodal metastasis status in SCC patients. ∗∗∗p < 0.001 vs. control.
